Notice: This Wiki is now read only and edits are no longer possible. Please see: https://gitlab.eclipse.org/eclipsefdn/helpdesk/-/wikis/Wiki-shutdown-plan for the plan.
Whats New in STEM
Contents
- 1 (new) status and plan for STEM5 on Cloud
- 2 (new) 2019 novel Corona Virus Model
- 3 The STEM community is pleased to announce the 2018 STEM Contributor of the Year Awards.
- 4 New features, features coming soon, and a historical list of some major STEM features
- 5 V4.0.0 is now available !!
- 6 V3.0.0 M3 now available for testing
- 7 V2.0.3 is now Available
- 8 V2.0.2 is now Available
- 9 V2.0.1 is now Available
- 10 V2.0.0 is now Available
- 11 V1.4.1
- 12 V1.4.0
- 13 V1.3.1
- 14 V1.3.0
- 15 12/10/2011 Improved Graphical Editor
- 16 11/21/2011 STEM release 1.2.3 is available for download
- 17 Improved Error Handling
- 18 See the new Chickenpox demo scenario
- 19 STEM now has demographic populations models with Aging
- 20 Time Series Reports now support graphs of Populations and Related properties
- 21 STEM V1.2.0 RC5 is up
- 22 Running STEM Headless
- 23 Global model for Anopheles Mosquito Risk is now available
- 24 Import your own Graphs using the Pajek standard format
- 25 Multi-Population Disease Model for Download
- 26 The classic Macdonald-Ross (Malaria) disease model is now available
- 27 Release 1.1.1 Offers New Features
- 28 New Integration tests and framework now available
- 29 Automated Experiment Tutorial
- 30 Hypothetical Zombie Pandemic: New (And Whimsical)
- 31 Earth Science Data
- 32 New Graph Wizard
- 33 Infectors, Inoculators, and Population Initializers Now Support UIDs for Arbitrary Graphs
- 34 External Files Implemented for Creating New Infectors and Inoculators
- 35 News Archives
(new) status and plan for STEM5 on Cloud
Please see the following pdf presentation by Ahmad Swaid File:STEM5.pdf
(new) 2019 novel Corona Virus Model
The STEM community is pleased to announce the 2018 STEM Contributor of the Year Awards.
New features, features coming soon, and a historical list of some major STEM features
V4.0.0 is now available !!
- See the STEM 4.0.0 Release Review Slides here File:STEMReleaseReview4 0.pdf
- Full Eclipse 4 and (J2SE) 8.0 JVM Compatibility
- Graphical Model Design (GUI for code generation, Visual Editor )
- Bug fixes from V3.0.0 M1,2,3 milestones
- Stochastic Solver now runs in batch mode
- New disease models and downloadable scenarios
V3.0.0 M3 now available for testing
- V3.0.0 M3 now available for testing
V2.0.3 is now Available
- Bug fixes from 2.0.2
- Admin 0 borders added
- New models
- Updated Google Earth(tm) Interface
V2.0.2 is now Available
V2.0.1 is now Available
V2.0.0 is now Available
Features
- Bug Fixes
- Performance improvements
- New Stochastic model solver
- Draggable solver objects
- Visual Editor (Integrated UI for creating new models of disease including domain specific language for epi modeling)
- New Measles model
- Directionally biased mixing model
- New Model Generator makes it easy for domain experts to create new STEM Models (no programming required) !!
- New Apache library
V1.4.1
"Completed" 12/14/2012
- STEM Model Generator for Developers
Release 1.4.1
V1.4.0
"Completed" 9/25/2012
- Performance improvements
- Simplified creation of new Disease and Population models (Tools for generating new disease plugins)
- Pajek-file Importer:
- Enable import of discrete transportation events
- Enable integration between user graphs and existing STEM graphs
- New improved MapView
- Enable visualization of discrete transportation events
- Enable multiple views of the same simulation
- Stochastic Modeling Framework
- Deep copy drag and drop for models
- Refactor
- Create new mixing edges (edges back in, generator created)
- Improved UI for decorators view
- Time adaptive external data source models
- New preferences
V1.3.1
Completed Date 4/15/2012
Plan Features: (Tentative Date 4/15/2012)
- Bug Fixes to 1.3.0
- STEM EMF update to version 2.7.2
- Generalized model replay mechanism
- Modifiable Modifiers (batch mode)
- Shape File Importer: Improvements to GUI
- Population Transformer: food mediated disease
- Graph Editor: improved features
- NEW Population re-scaler
- NEW framework and examples for modeling food borne disease including transformation of populations to food, and mapping of disease in populations to diseases of food.
V1.3.0
Completed Date 2/7/2012 Features
- Bug Fixes from 1.2.2
- Ten years of Earth Science Data (2000-2010) available as STEM Features
- Malaria Disease Model (Anopheles calibrated)
- Dengue Fever Disease Model (Aedes not yet calibrated)
- New Differential Equation solver(s) from commons.math library
- Additional NLS + User ability to switch languages
- Logger Framework with new loggers
- New feature: “Population Transformer” - enabling transformation of population members to allow modeling of e.g. food mediated disease transmission
- Improvements to the graphical editor
12/10/2011 Improved Graphical Editor
Overlaying edges are now displayed by having them bent when more than one edge connects two nodes. Migration edges can be edited (population id and migration rate), Common Border Edges can be edited (border length). Two nodes (when selected) can be connected with edges (select type in context-menu opened with a right-click).
11/21/2011 STEM release 1.2.3 is available for download
The release includes many bug fixes as well as improved error handling. You can download it here
Improved Error Handling
We have improved the error handling code in STEM to make it easier for users to detect when they have composed an invalid scenario.
See the new Chickenpox demo scenario
Available on the STEM home page (downloadable scenarios)
STEM now has demographic populations models with Aging
initial documentation may be found on the wiki page Using Aging Populations in STEM
Time Series Reports now support graphs of Populations and Related properties
STEM V1.2.0 RC5 is up
Running STEM Headless
See the new documentation on how to run STEM in Headless mode. This is the way you can remotely run massive numbers of simulations!!
Global model for Anopheles Mosquito Risk is now available
This model uses earth science data and was calibrated based on an Anopheles survey in Thailand . In an attempt to identify environmental conditions favoring malaria transmission, a mathematical risk index prediction model for Anopheles was created using four primary factors: rainfall, temperature, elevation, and vegetation. To assess the performance of our model, we compared the predicted risk generated by our model to data from four separate regions around the globe. (a preprint is available on request). Mosquito risk models like this are often used to asses Malaria risk. We hope to use this model as input to a more sophisticated mathematical model for Malaria and as an example of how to use STEM to study Zoonotic disease. click here for downloadable scenario
Import your own Graphs using the Pajek standard format
A new example project is available that demonstrates the new feature Importing a Pajek Graph. To see the example, go to the Downloadable Scenario (New) Pajek Import Example. Please also see the documentation on how to use Pajek with STEM. The PajekNetGraphGenerator was created and developed by the Department of Biological Safety of the Federal Institute for Risk Assessment in Germany.
Multi-Population Disease Model for Download
A new scenario for multi-population disease spreading between anopheles mosquitoes and humans on a square lattice is now available on STEM for downloading. Please also see the documentation Multi-Population Example
The classic Macdonald-Ross (Malaria) disease model is now available
For developers who want to check out the code directly from the STEM SVN branch, there are two new new plugins available:
org.eclipse.stem.diseasemodels.vector
org.eclipse.stem.ui.diseasemodels.vector
If you add them to your STEM launch configuration, you'll have a new "Macdonald Ross" disease model available to you. Currently, the model is the most basic possible, an SI model that does not take into account the latent period (both human and vector) as well as immunity. The model comes directly out of the standard Anderson & May textbook, chapter 14.3 (basic model for malaria), the differential equations on page 394. In the future we will add more advanced vector models to this plugin.
Release 1.1.1 Offers New Features
January 27, 2011. In addition to many bug fixes, the 1.1.1 release of STEM contains new global earth science data, including elevation and monthly rainfall, vegetation and temperature. To see an example of how the earth science data can be used to model mosquito densities in Asia, you can download an example scenario here (requires the global earth science models as well as the global geography models):
New Integration tests and framework now available
The plugin org.eclipse.stem.tests.core now contains a test suite called "ScenarioIntegrationTests". Running the suite as a JUnit plugin test does the following:
1. It reads each project stored under the resources folder in the plugin (right now there's only one, "BasicTests")
2. It runs each scenario in the project and checks to make sure the models generate "valid" results. By valid we mean: 1. That the compartment states (e.g. S+I+R) adds up to the total population. 2. That no compartment ever goes negative. 3.
That the log files generated by the  scenarios agrees with a reference stored under the "Recorded Simulations/IntegrationTest" folder.
The scenarios tested right now includes basic single location SI, SIR SEIR scenarios, scenarios with mixing between two nodes, scenarios with mixing/migration between two nodes, scenarios having air transportation and scenarios including a percentage of the population being inoculated. More tests will be added soon (e.g. multi-population disease models, population model tests) to test all aspects of STEM end-to-end. For developers, please make sure you test your code by running (at least) the integration tests to avoid breaking things.
Automated Experiment Tutorial
September 2010. A tutorial for the Automated Experiment function is now available at http://wiki.eclipse.org/Running_an_Automated_Experiment. The tutorial explains how this function allows the user to sweep through a range of parameter values for a disease model, running and logging the results for every possible combination of parameter values.
This tutorial will be of special interest to those who have downloaded the sample project using this feature at http://www.eclipse.org/stem/download_sample.php?file=AutomatedExperimentExample.zip and read the documentation for that sample project at http://wiki.eclipse.org/Sample_Projects_available_for_Download#Automated_Experiment_Example.
Hypothetical Zombie Pandemic: New (And Whimsical)
August 2010. In a fun test of STEM's ability to rapidly prototype new disease models, T. Parviainen used STEM to enter a 48 hour programming competition. He created a visualization for a hypothetical zombie pandemic: http://teropa.no.de/. To read more about the epidemiology of zombies see also this paper by Philip Munz et al. (http://www.mathstat.uottawa.ca/~rsmith/Zombies.pdf) Follow the zombie thread on the news group. Read comments about Parviainan’s entry at http://nodeknockout.com/teams/teropa.
Earth Science Data
August 2010. STEM now includes earth science datasets for global surface elevation, total rainfall, land surface temperature, and vegetation. Inclusion of these earth science data sets provides the foundation for simulation of mosquito-borne and other zoonotic diseases. Monthly data is provided for total rainfall, land surface temperature, and vegetation. Calculations provided within the earth science data sets include surface roughness calculations such as average, standard deviation, maximum, minimum, range, skewness, kurtosis, and root mean square.
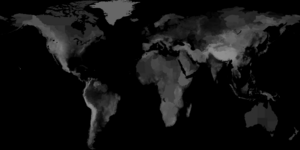
- Surface Elevation.
Data for surface elevation (in meters) were obtained from the NOAA Global Land One-Kilometer Base Elevation Project (GLOBE).
The highest possible elevation was 8,752 meters and the lowest possible global surface elevation was -407 meters.
Bathymetric elevation data is not included in the global surface elevation data.
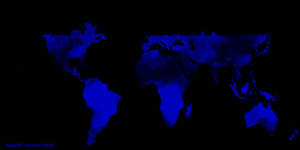
- Total Rainfall.
Data for total rainfall (in millimeters) were obtained for each month from the NASA Earth Observatory (NEO).
The NEO data is derived from the The Tropical Rainfall Measuring Mission (TRMM).
The highest possible value was 2000.0 millimeters of rainfall and the smallest 1.0 millimeter of total rainfall for each month.
Total rainfall data are not available for countries and regions that are located above 35 degrees North
and below 35 degrees South Latitude (as evidenced in the image, places without data are in black).
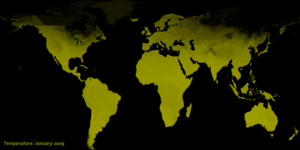
- Land Surface Temperature.
Data for land surface temperature (in degrees Celsius) were obtained for each month from the NASA Earth Observatory (NEO).
The source of the land surface temperature data is the NASA Moderate Resolution Imaging Spectroradiometer Terra/MODIS.
The highest possible temperature is 45.0 degrees Celsius and the lowest is -25.0 degrees Celsius.
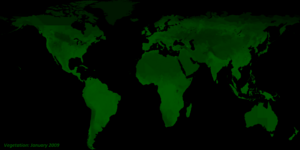
- Vegetation. Data for vegetation were obtained from the NASA Earth Observatory (NEO).
The data source for the normalized difference vegetation index [NDVI] (250m) is Terra/MODIS.
NDVI provides continuity with NOAA’s AVHRR NDVI time series record for historical and climate applications.
Values for vegetation based on NDVI are also described in wikipedia Normalized Difference Vegetation Index.
The highest possible index for global vegetation is an NDVI index of 0.9 and the lowest an NDVI index of -0.1.
- Acknowledgments
1. Elevation data: GLOBE Task Team and others (Hastings, David A., Paula K. Dunbar, Gerald M. Elphingstone, Mark Bootz, Hiroshi Murakami, Hiroshi Maruyama, Hiroshi Masaharu, Peter Holland, John Payne, Nevin A. Bryant, Thomas L. Logan, J.-P. Muller, Gunter Schreier, and John S. MacDonald), eds., 1999. The Global Land One-kilometer Base Elevation (GLOBE) Digital Elevation Model, Version 1.0. National Oceanic and Atmospheric Administration, National Geophysical Data Center, 325 Broadway, Boulder, Colorado 80305-3328, U.S.A. Digital data base on the World Wide Web (URL: http://www.ngdc.noaa.gov/mgg/topo/globe.html) and CD-ROMs.
2. Rainfall, Temperature, and Vegetation: Data is derived from NASA’s Earth Observatory. Thank you NASA!!
Currently, only earth science data for 2009 is built into STEM for total rainfall, land surface temperature, and vegetation. Provided in the thumbnails are animations of these earth science data sets over the year.
New Graph Wizard
June 2010. STEM now supports user creation of custom lattices via the New Graph wizard. The wizard makes use of "Graph Generators," a new concept. A graph generator is a pluggable component that is able to generate a graph (a collection of nodes and edges) either algorithmically or from an external file. Currently, we have implemented an abstract Lattice Graph Generator with a Square Lattice Implementation. A user can specify the size of the lattice as well as several options for how the nearest neighbor (Common Border) are organized. In the future we plan to also support creating a New Graph From File.
Infectors, Inoculators, and Population Initializers Now Support UIDs for Arbitrary Graphs
June 2010. Several wizards (Infector/Inoculator, Population Model, Population Initializer) now use a consolidated location picker dialog that gives users the option of selecting any location within the currently selected project. This allows the user to pick for instance one of the automatically generated grids on the lattice graph. Whatever UIDs exist in the user’s graph can be applied. The dialog also filters down the number of possible locations dramatically from all regions in the world to only the ones that are applicable in the current project.
External Files Implemented for Creating New Infectors and Inoculators
June 2010. There are now several new options available when a new infector or inoculator is created. First, it is possible to create an infector or inoculator by importing data from external files in the form of the comma separated files used by the STEM logger. A collection of infectors/inoculators can either be created from the first, last or any manually specified row from such files. We have found this feature extremely valuable when "boot-strapping" the initial state of a disease from a steady state (e.g., the seasonal flu state of the population in the summer time for northern hemisphere).
News Archives
For past news items, go to the STEM Archives at Older News


