Notice: This Wiki is now read only and edits are no longer possible. Please see: https://gitlab.eclipse.org/eclipsefdn/helpdesk/-/wikis/Wiki-shutdown-plan for the plan.
Difference between revisions of "STEM Model Creator/Tutorials"
(→Enter Rate Equations) |
(→Tutorial 3: Add seasonal modulation to the SEIR model) |
||
| (108 intermediate revisions by the same user not shown) | |||
| Line 1: | Line 1: | ||
| − | == | + | == Tutorial 1: Create a textbook SEIR model by extending SIR == |
| + | === Getting Started === | ||
| + | This tutorial shows how to create a new SEIR Disease Model by extending the existing SIR Disease Model using the STEM Model Generator, Visual Editor, and Expression Language - ''all without writing a line of Java code''. STEM already has a built-in SEIR model, so this is more a how-to demo for creating new disease models. | ||
| − | + | Before you begin, you should understand how [[Introduction_to_Compartment_Models|compartment models work in STEM]]. Also, please look over the [[STEM Model Creator]] and [[STEM Expression Language]] documents. | |
| − | + | ||
| − | + | === Create Model Project and Disease Model === | |
# Launch the STEM application | # Launch the STEM application | ||
# Open the ''' Designer ''' perspective | # Open the ''' Designer ''' perspective | ||
# From the ''' New ''' menu, select ''' Model Generator Project ''' | # From the ''' New ''' menu, select ''' Model Generator Project ''' | ||
| − | #: [[Image:STEM_ModelCreator_NewModelGeneratorProject.png]] | + | #: [[Image:STEM_ModelCreator_NewModelGeneratorProject.png|300px]] |
#Choose '''Create and configure a new STEM Model Package''' | #Choose '''Create and configure a new STEM Model Package''' | ||
#Click '''Next''' | #Click '''Next''' | ||
#On the ''' Model Package ''' page, enter the following values: | #On the ''' Model Package ''' page, enter the following values: | ||
| − | #* Package Name: '''Demo''' | + | #* ''Package Name:'' '''Demo''' |
| − | #* Package Prefix: '''com.example.diseasemodels''' | + | #* ''Package Prefix:'' '''com.example.diseasemodels''' |
#Click ''' Add Model ''' to add the disease model | #Click ''' Add Model ''' to add the disease model | ||
#On the ''' Model Properties''' page, enter these values: | #On the ''' Model Properties''' page, enter these values: | ||
| − | #* Model Name: '''MySEIR''' | + | #* ''Model Name:'' '''MySEIR''' |
| − | #* Model Type: ''' Disease Model ''' | + | #* ''Model Type:'' ''' Disease Model ''' |
| − | #* Parent Model: Select '''SIR''' from the list | + | #* ''Parent Model:'' Select '''SIR''' from the list |
| − | + | ||
#Click '''Finish''' | #Click '''Finish''' | ||
# At this point, your package properties should look like this: | # At this point, your package properties should look like this: | ||
| − | #: | + | #: [[Image:STEM VisualEditor SEIRTutorial PackageSettings.png|300px]] |
# Click '''Finish''' to run the Model Generator and create your model project | # Click '''Finish''' to run the Model Generator and create your model project | ||
#:''This step may take 1-2 minutes to complete'' | #:''This step may take 1-2 minutes to complete'' | ||
# After the Model Generator finishes, the Visual Editor should automatically open | # After the Model Generator finishes, the Visual Editor should automatically open | ||
| − | #: | + | #: [[Image:STEM VisualEditor SEIRTutorial InitialLayout.png|300px]] |
| − | + | === Add New Compartment === | |
| − | Now that your model project is created, it's time to add new parameters and compartments. First, | + | Now that your model project is created, it's time to add new parameters and compartments. First, let's create a new compartment. |
We're creating an S-E-I-R model, which is made up of compartments S, E, I, and R. Since we extended the built-in S-I-R model, we need to add a new E compartment. | We're creating an S-E-I-R model, which is made up of compartments S, E, I, and R. Since we extended the built-in S-I-R model, we need to add a new E compartment. | ||
| − | # In the Visual Editor, click the ''' Add Compartment ''' button | + | # In the Visual Editor, click the ''' Add Compartment ''' button |
| − | #: | + | #: [[Image:STEM_VisualEditor_Toolbar_AddCompartment.png]] |
# In the '''Add Compartment''' dialog, enter the following values | # In the '''Add Compartment''' dialog, enter the following values | ||
| − | #* Name: ''' e ''' (make sure this is lower case) | + | #* ''Name:'' ''' e ''' (make sure this is lower case) |
| − | #* Compartment Type: ''' Standard ''' | + | #* ''Compartment Type:'' ''' Standard ''' |
| − | #* Data Type: ''' double ''' | + | #* ''Data Type:'' ''' double ''' |
| + | #: [[Image:STEM_VisualEditor_SEIRTutorial_AddCompartment.png]] | ||
# Click '''Finish''' | # Click '''Finish''' | ||
| − | # A new ''' e ''' box now appears in the diagram | + | # A new ''' e ''' box now appears in the diagram |
| − | # You may want to rearrange the | + | # You may want to rearrange or resize the compartment boxes so that the S, E, I, and R boxes are in order (easier when connecting the compartments) |
| − | #: '' To rearrange, ''' select a compartment''' and ''' drag ''' it to a new location | + | #: '' To rearrange, ''' select a compartment''' and ''' drag ''' it to a new location '' |
| − | #: [ | + | #: [[Image:STEM VisualEditor SEIRTutorial RearrangedLayout.png]] |
That's it. You've added a new compartment to your model. This is now a S-E-I-R model. | That's it. You've added a new compartment to your model. This is now a S-E-I-R model. | ||
| − | + | === Add New Model Parameter === | |
In addition to inheriting compartments from the parent SIR model, the new model also inherits the model (or rate) parameters from SIR. Inherited parameters include '''Transmission Rate''' (transmissionRate), '''Recovery Rate''' (recoveryRate), '''Immunity Loss Rate''', etc. | In addition to inheriting compartments from the parent SIR model, the new model also inherits the model (or rate) parameters from SIR. Inherited parameters include '''Transmission Rate''' (transmissionRate), '''Recovery Rate''' (recoveryRate), '''Immunity Loss Rate''', etc. | ||
| − | We already added the new '''E'''xposed state to the disease model. In the textbook SEIR example, the movement from the '''E''' to '''I''' compartments is | + | We already added the new '''E'''xposed state to the disease model. In the textbook SEIR example, the rate controlling movement from the '''E''' to '''I''' compartments is the '''Incubation Rate'''. The next step is to add the '''incubationRate''' model parameter to the '''MySEIR''' model. |
| − | # In the Visual Editor, click the ''' Edit Model ''' button | + | # In the Visual Editor, click the ''' Edit Model ''' button |
| − | #: [ | + | #: [[Image:STEM_VisualEditor_Toolbar_EditModel.png]] |
# In the '''Edit Model''' dialog, click the ''' Add Parameter ''' button | # In the '''Edit Model''' dialog, click the ''' Add Parameter ''' button | ||
# In the '''Edit Parameter''' dialog, enter the following values: | # In the '''Edit Parameter''' dialog, enter the following values: | ||
| − | #* Name: ''' incubationRate ''' | + | #* ''Name:'' ''' incubationRate ''' |
| − | #* Display Name: ''' Incubation Rate ''' | + | #* ''Display Name:'' ''' Incubation Rate ''' |
| − | #* Data Type: ''' double ''' (default) | + | #* ''Data Type:'' ''' double ''' (default) |
| − | #* Default Value: '''0.0''' (default) | + | #* ''Default Value:'' '''0.0''' (default) |
#* Optionally, add a '''minValue''' constraint of 0.0 | #* Optionally, add a '''minValue''' constraint of 0.0 | ||
# Click ''' OK ''' to add the parameter | # Click ''' OK ''' to add the parameter | ||
| + | #: [[Image:STEM VisualEditor SEIRTutorial EditModel.png|300px]] | ||
# Click ''' OK ''' again to apply the changes | # Click ''' OK ''' again to apply the changes | ||
| − | + | === Regenerate the Model Project === | |
Changing a model's parameters or compartments requires a '''Model Regeneration'''. This operations rebuilds several of the key Java files that make up the structure of your model project. For more information, see the [[STEM_Model_Creator#Model Regeneration|section on Model Regeneration]]. | Changing a model's parameters or compartments requires a '''Model Regeneration'''. This operations rebuilds several of the key Java files that make up the structure of your model project. For more information, see the [[STEM_Model_Creator#Model Regeneration|section on Model Regeneration]]. | ||
To run the Model Generator: | To run the Model Generator: | ||
| − | # In the ''' Visual Editor ''', save the | + | # In the '''Visual Editor''', save the '''MySEIR''' model |
# Click the ''' Model Generator ''' button in the Visual Editor Toolbar | # Click the ''' Model Generator ''' button in the Visual Editor Toolbar | ||
| − | #: [ | + | #: [[Image:STEM_VisualEditor_Toolbar_ModelGenerator.png]] |
| − | # If prompted, save the | + | # If prompted, save the model file |
# In the ''' Model Generator ''' wizard, immediately click ''' Finish ''' | # In the ''' Model Generator ''' wizard, immediately click ''' Finish ''' | ||
# Wait while the model is regenerated | # Wait while the model is regenerated | ||
| Line 78: | Line 80: | ||
After the Model Generator wizard closes, you're ready to implement the model's transitions and expressions. | After the Model Generator wizard closes, you're ready to implement the model's transitions and expressions. | ||
| − | + | === Create Transitions and Expressions === | |
| − | + | Now that the initial setup is finished, you're now ready for the fun part - creating the '''Transitions''' that describe the movement of a population between compartments in the disease model. | |
| − | Transitions have | + | Transitions have four pieces: |
| − | * The | + | * The source compartment |
| − | * The | + | * The target compartment |
* The equation that describes the flow rate out of the source compartment and into the target compartment per time step | * The equation that describes the flow rate out of the source compartment and into the target compartment per time step | ||
| + | * The list of incidences the transition counts toward | ||
| − | With the | + | With the '''Visual Editor''', you can easily draw the transitions as directed graph edges between a source and target compartment then use the '''[[STEM Expression Language#Expression Editor|STEM Expression Editor]]''' to enter the rate equations. |
| − | + | ==== Draw Transitions ==== | |
| − | For | + | For the '''MySEIR''' model, we will create transitions between these compartments |
| − | + | :{| cellspacing="0" cellpadding="5" border="1" | |
| − | + | |- | |
| − | + | | '''Source''' | |
| − | + | | '''Target''' | |
| − | + | | '''Transition''' | |
| + | |- | ||
| + | | s | ||
| + | | e | ||
| + | | S → E | ||
| + | |- | ||
| + | | e | ||
| + | | i | ||
| + | | E → I | ||
| + | |- | ||
| + | | i | ||
| + | | r | ||
| + | | I → R | ||
| + | |- | ||
| + | | i | ||
| + | | diseaseDeaths | ||
| + | | I → diseaseDeaths | ||
| + | |- | ||
| + | | r | ||
| + | | s | ||
| + | | R → S | ||
| + | |} | ||
To draw transitions: | To draw transitions: | ||
| − | # In the Visual Editor, select the ''' Draw Transition Tool ''' button | + | # In the Visual Editor, select the ''' Draw Transition Tool ''' button |
| − | #: [ | + | #: [[Image:STEM_VisualEditor_Toolbar_DrawTransition.png]] |
| − | # To create the S → E transition: | + | # To create the '''S → E''' transition: |
#* Select the '''S''' compartment as the source. '''Click once''' on the '''s''' compartment box | #* Select the '''S''' compartment as the source. '''Click once''' on the '''s''' compartment box | ||
#* Select the '''E''' compartment as the target. '''Move the mouse to''' and '''click once''' on the '''e''' compartment box | #* Select the '''E''' compartment as the target. '''Move the mouse to''' and '''click once''' on the '''e''' compartment box | ||
# You should now see a directed connector between the '''s''' and '''e''' compartment boxes | # You should now see a directed connector between the '''s''' and '''e''' compartment boxes | ||
| − | #: [ | + | #: [[Image:STEM_VisualEditor_SEIRTutorial_FirstTransition.png]] |
# Repeat for the other transitions listed above | # Repeat for the other transitions listed above | ||
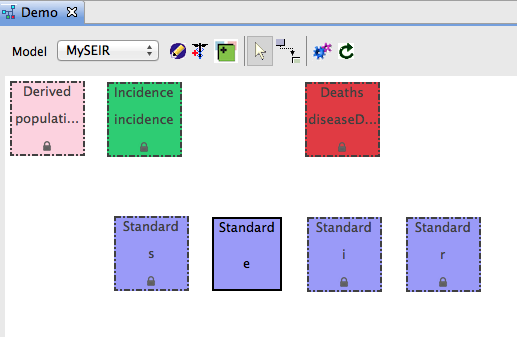
# After you create all five transitions, your diagram should look like this: | # After you create all five transitions, your diagram should look like this: | ||
| − | #: [ | + | #: [[Image:STEM VisualEditor SEIRTutorial AllTransitions.png]] |
| − | + | ==== Enter Rate Equations ==== | |
| − | For our | + | For our '''MySEIR''' model, the next step is to enter the equations for the five transitions we created in the previous step. |
Using the ''' Expression Editor ''', you can easily enter the equations that represent the state changes in your model as STEM Expressions. For more information, please read about the [[STEM Expression Language]] and the [[STEM Expression Language#Expression Editor|Expression Editor]]. | Using the ''' Expression Editor ''', you can easily enter the equations that represent the state changes in your model as STEM Expressions. For more information, please read about the [[STEM Expression Language]] and the [[STEM Expression Language#Expression Editor|Expression Editor]]. | ||
# In the Visual Editor, select the '''Chooser tool''' in the toolbar | # In the Visual Editor, select the '''Chooser tool''' in the toolbar | ||
| − | #: [ | + | #: [[Image:STEM_VisualEditor_Toolbar_Chooser.png]] |
# Select '''connector edge''' between the ''' s ''' and ''' e ''' compartment boxes | # Select '''connector edge''' between the ''' s ''' and ''' e ''' compartment boxes | ||
# In the ''' Expression Editor ''', enter the equation expression | # In the ''' Expression Editor ''', enter the equation expression | ||
| Line 122: | Line 146: | ||
#: '' ''' Tip ''' You can use auto-completing expression assistance as you enter your expression. Just type ''' Control - S ''' as you type for the assistance dialog! '' | #: '' ''' Tip ''' You can use auto-completing expression assistance as you enter your expression. Just type ''' Control - S ''' as you type for the assistance dialog! '' | ||
#* For S → E, select the box next to ''' incidence ''' under ''' For Incidence ''' | #* For S → E, select the box next to ''' incidence ''' under ''' For Incidence ''' | ||
| − | #*: '' This tells the STEM simulation to count this transition as part of the disease incidence | + | #*: '' This tells the STEM simulation engine to count this transition as part of the disease incidence |
| − | #: [ | + | #: [[Image:STEM_VisualEditor_SEIRTutorial_ExpressionEditor.png|300px]] |
# Repeat these steps for the other transitions in the model, entering these expressions for the transition: | # Repeat these steps for the other transitions in the model, entering these expressions for the transition: | ||
| − | :{| cellspacing="0" cellpadding="5" border="1" | + | ::{| cellspacing="0" cellpadding="5" border="1" |
|- | |- | ||
| '''Transition''' | | '''Transition''' | ||
| Line 152: | Line 176: | ||
|} | |} | ||
| − | ==== Create Disease and Add to Scenario ==== | + | === Save your Model === |
| + | Before you continue, be sure to ''' Save ''' the model. This will tell STEM to generate the Java code that implements your disease model and install it into the STEM application. | ||
| + | |||
| + | To save the open model in the Visual Editor, either do ''' Control - S ''' ( ''' Command - S ''' on Mac OS X) or open the '''File''' menu and select '''Save'''. | ||
| + | |||
| + | === Summary === | ||
| + | That's it! You've now created a simple, textbook S-E-I-R disease model using the STEM Model Creator. In the next section/tutorial, you'll learn how to use the new model in a STEM simulation. | ||
| + | |||
| + | == Tutorial 2: Run a Disease Simulation using the MySEIR model == | ||
| + | === Getting Started === | ||
| + | In the previous tutorial, you used the STEM Model Generator to create and build a fully functional SEIR disease model in STEM. You're now ready to run your new '''MySEIR''' disease model in STEM. If you're new to STEM, at this point you may want to look through the [[Creating_a_STEM_Scenario|STEM Scenario guide]] to understand how STEM scenarios, models, and simulations work. | ||
| + | |||
| + | To simplify this tutorial, we've provided a simple demo scenario project with pre-built scenarios, geographic models, infectors, innoculators, and sequencers. In this tutorial, we'll import the project into STEM, create a new disease instance of your '''MySEIR''' disease model, add the disease to a geographic model, and run a STEM simulation. | ||
| + | |||
| + | === Download and Import Demo Project & Scenario === | ||
| + | The first step is to download the '''VisualEditorDemo''' project and import it into STEM | ||
| + | |||
| + | # '''[[Media:VisualEditorDemo.zip|Download the Visual Editor Demo project]]''' zip file | ||
| + | # In the STEM application, open the ''' File ''' menu and select ''' Import ''' | ||
| + | # In the '''Import Wizard''', under '''General''', select '''Existing projects into Workspace''' | ||
| + | # Click '''Next''' | ||
| + | # Click the radio button next to '''Select Archive File''' | ||
| + | # Click '''Browse''' and navigate to the location you downloaded ZIP file | ||
| + | # Select '''VisualEditorDemo.zip''' and click '''Open''' | ||
| + | # Verify ''' VisualEditorDemo ''' is listed under '''Projects''' | ||
| + | # Click '''Finish''' | ||
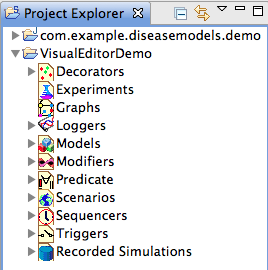
| + | #: '' The '''VisualEditorDemo''' project should now appear in the '''Project Explorer''' '' | ||
| + | #: [[Image:STEM VisualEditor SEIRTutorial ProjectExplorerAfterImport.png]] | ||
| + | |||
| + | === Create MySEIR Disease === | ||
| + | Next, we want to create an instance of our new MySEIR disease model. | ||
| + | |||
| + | # In STEM, open the '''New''' menu and select '''Disease''' | ||
| + | #: '' You can also click the '''New Disease''' icon in the toolbar '' | ||
| + | #: [[Image:STEM_VisualEditor_NewDiseaseToolbar.png]] | ||
| + | # In the '''New Disease''' wizard, make sure '''VisualEditorDemo''' is the selected project | ||
| + | # For '''Name''', enter '''SeasonalFlu''' | ||
| + | # From the '''Disease Model''' drop-down, choose '''MySEIR''' (probably at the bottom of the list) | ||
| + | # For '''Disease Name''', enter '''flu''' (lower case) | ||
| + | # Enter appropriate rate parameter values. For this demo, here are some suggestions: | ||
| + | #* ''Transmission Rate'': '''1.2''' | ||
| + | #* ''Infectious Recovery Rate'': '''0.3''' | ||
| + | #* ''Immunity Loss Rate'': '''0.05''' | ||
| + | #* ''Incubation Rate'': '''0.5''' | ||
| + | #* ''All others'': '''defaults''' | ||
| + | #: [[Image:STEM VisualEditor SEIRTutorial AddDisease.png|300px]] | ||
| + | # Click '''Finish''' to create the new disease | ||
| + | |||
| + | === Add Disease to Geographic Model === | ||
| + | Next, we'll add the new Disease to the pre-built geographic model. | ||
| + | |||
| + | # In the STEM '''Project Explorer''', expand the '''VisualEditorDemo''' project | ||
| + | # Expand the '''Models''' folder. '''Double-click''' on '''CubaDisease.model''' | ||
| + | #: ''The '''CubaDisease.model''' editor should open'' | ||
| + | # In '''Project Explorer''', expand the '''Decorators''' folder | ||
| + | # Select '''My SEIR flu''', '''drag''' and '''drop''' into the '''CubaDisease.model''' editor root | ||
| + | #: [[Image:STEM VisualEditor SEIRTutorial DragToModel.png]] | ||
| + | # '''Save''' and '''Close''' the '''CubaDisease.model''' editor | ||
| + | |||
| + | === Launch the Scenario as a STEM Simulation === | ||
| + | You're finally ready to see the results of all the work. You will now launch the pre-built scenario as a STEM simulation and observe the epidemic curve as a time series chart. | ||
| + | |||
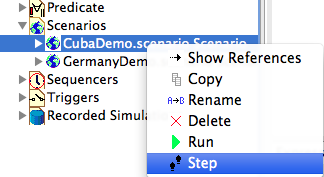
| + | # In the '''Project Explorer''', expand the '''Scenarios''' folder | ||
| + | # '''Right Click''' on '''CubaDemo.scenario''' and select '''Step''' | ||
| + | #: '' This will launch a simulation and open the Simulation perspective '' | ||
| + | #: [[Image:STEM VisualEditor SEIRTutorial StepScenario.png]] | ||
| + | # On the '''Graph Map''', '''double click''' on the Cuba polygon to open a '''Time Series''' tracker | ||
| + | # Under '''Simulation''', click the ''' Run Button ''' [[Image:STEM_VisualEditor_SEIRTutorial_StartButton.png]] to start the simulation | ||
| + | # '' Wait while the simulation runs, watching the Time Series view of the epidemic curve | ||
| + | #: [[Image:STEM_VisualEditor_SEIRTutorial_SimulationComplete.png|300px]] | ||
| + | # Your time series plot should look like this: | ||
| + | #: [[Image:STEM VisualEditor SEIRTutorial TimeSeriesComplete.png]] | ||
| + | # When the simulation finishes, you can click the '''Stop Button''' [[Image:STEM_VisualEditor_SEIRTutorial_StopButton.png]] | ||
| + | |||
| + | === Summary === | ||
| + | You're finished! You've successfully authored a simple, textbook SEIR disease model, created a disease instance in STEM, and run a simple spatiotemporal simulation. Obviously this is not a real-world example, but it's a good introduction to using the STEM Model Creator, Visual Editor, and Expression Language to easily author compartmental models of disease. | ||
| + | |||
| + | In the next tutorial, you will build on this existing model to add more complicated features, such as sinusoidal and temperature forcing to create a seasonal variation in your disease model. | ||
| + | |||
| + | == Tutorial 3: Add seasonal modulation to the SEIR model == | ||
| + | === Getting Started === | ||
| + | In this tutorial, we are going to extend the '''MySEIR''' disease model previously created to add a seasonal modulation to transmission. We will create two different modulations - one using a sinusoidal function and then one that uses the STEM Earth Science data to be temperature-dependent. | ||
| + | |||
| + | === Sinusoidal === | ||
| + | In this example, we'll add a '''Modulation Period''' parameter to the '''MySEIR''' then use the built-in sin(...) function to apply a sinusoidal modulation to the transmission rate. | ||
| + | |||
| + | If you've previously closed the '''Visual Editor''', reopen the '''MySEIR''' model | ||
| + | # In the '''Project Explorer''' expand '''com.example.diseasemodels.demo''' project | ||
| + | # Expand the '''model''' folder | ||
| + | # Double click on '''demo.metamodel''' to open the '''Visual Editor''' | ||
| + | # Add the '''Modulation Period''' parameter (''[[#Add_New_Model_Parameter|Adding a model parameter]]'') | ||
| + | #* ''Name:'' '''modulationPeriod''' | ||
| + | #* ''Display Name:'' '''Modulation Period''' | ||
| + | #* ''Data Type:'' '''double''' | ||
| + | #* ''Default Value:'' '''365.25''' (one year) | ||
| + | #* Add a '''minValue''' constraint of '''0.0''' | ||
| + | # '''Remember to run the [[#Regenerate_the_Model_Project|Model Regenerator]] | ||
| + | # Select the '''S → E''' transition | ||
| + | # In the '''Expression Editor''' | ||
| + | #: First add a '''seasonalModulation''' local variable | ||
| + | #:: <code>seasonalModulation = 1+sin(2*3.14*t/modulationPeriod);</code> | ||
| + | #: Then add the '''seasonalModulation''' to the expression '''delta''': | ||
| + | #:: <code>delta transmissionRate*S*effective(i)*seasonalModulation/2</code> | ||
| + | # Final expression should look like: | ||
| + | #: [[Image:STEM VisualEditor SEIRTutorial SinExpression.png]] | ||
| + | # '''Save''' the '''MySEIR''' model | ||
| + | # Now [[#Launch_the_Scenario_as_a_STEM_Simulation|re-run the '''CubaDemo.scenario''']] simulation to see the change in the Time Series graph | ||
| + | #: [[Image:STEM VisualEditor SEIRTutorial SinTimeSeries.png|400px]] | ||
| + | |||
| + | === Temperature-dependent === | ||
| + | Next you're going to change the seasonal modulation from a sinusoidal function to be temperature-dependent. To get temperature data, you'll use the '''temperature()''' function that comes with the STEM Expression Language. The '''temperature()''' function uses the STEM Earth Science data applied to each region in your geographic model. | ||
| + | |||
| + | To access temperature data, you must first: | ||
| + | * Install the [[STEM_Addons|Earth Science Add-on]] into STEM | ||
| + | * Add the Earth Science data labels to your geographic model | ||
| + | *: '' In our '''VisualEditorDemo''' project, this the data is already added to the Germany model '' | ||
| + | |||
| + | Next change the expression to add the '''temperature()''' function | ||
| + | # In the '''Visual Editor''', select the '''MySEIR''' model | ||
| + | # Select the '''S → E''' transition | ||
| + | # In the '''Expression Editor''', change the expression to: | ||
| + | #: <code>seasonalModulation = max(temperature()/10,0);</code> | ||
| + | #: <code>delta transmissionRate*S*effective(i)*seasonalModulation;</code> | ||
| + | # This is what the expression should look like: | ||
| + | #: [[Image:STEM_VisualEditor_SEIRTutorial_TemperatureExpression.png]] | ||
| + | # '''Save''' the '''MySEIR''' model | ||
| + | # In the '''Project Explorer''', expand the '''VisualEditorDemo''' project | ||
| + | # Under '''models''', open '''GermanyDisease.model''' | ||
| + | # Drag and drop the '''MySEIR flu''' disease into the '''GermanyDisease.model''' root | ||
| + | # '''Save''' and '''Close''' the '''GermanyDisease.model''' editor | ||
| + | # Next, under '''Scenarios''', right click on '''GermanyDemo.scenario''' and select '''Run''' | ||
| + | # In the '''Simulation''' perspective, double click on one of the Germany regions to add a '''Time Series''' tracker | ||
| + | #: You may need to restart the scenario after this | ||
| + | # After the simulation finishes, you should see a ''' Time Series''' that looks like this: | ||
| + | #: [[Image:STEM_VisualEditor_SEIRTutorial_TemperatureTimeSeries.png|400px]] | ||
| + | #: [[Image:STEM VisualEditor SEIRTutorial GermanyMap.png|300px]] | ||
| − | === | + | === Summary === |
| + | You've now successfully modified a textbook SEIR model to add a simple seasonal modulation. At this point, you can now begin exploring how to use the STEM Model Creator and Expression Language to tackle more sophisticated disease models. | ||
| − | + | More tutorials will be coming soon! | |
Latest revision as of 13:49, 26 June 2013
Contents
Tutorial 1: Create a textbook SEIR model by extending SIR
Getting Started
This tutorial shows how to create a new SEIR Disease Model by extending the existing SIR Disease Model using the STEM Model Generator, Visual Editor, and Expression Language - all without writing a line of Java code. STEM already has a built-in SEIR model, so this is more a how-to demo for creating new disease models.
Before you begin, you should understand how compartment models work in STEM. Also, please look over the STEM Model Creator and STEM Expression Language documents.
Create Model Project and Disease Model
- Launch the STEM application
- Open the Designer perspective
- From the New menu, select Model Generator Project
-
- Choose Create and configure a new STEM Model Package
- Click Next
- On the Model Package page, enter the following values:
- Package Name: Demo
- Package Prefix: com.example.diseasemodels
- Click Add Model to add the disease model
- On the Model Properties page, enter these values:
- Model Name: MySEIR
- Model Type: Disease Model
- Parent Model: Select SIR from the list
- Click Finish
- At this point, your package properties should look like this:
-
- Click Finish to run the Model Generator and create your model project
- This step may take 1-2 minutes to complete
- After the Model Generator finishes, the Visual Editor should automatically open
-


Add New Compartment
Now that your model project is created, it's time to add new parameters and compartments. First, let's create a new compartment.
We're creating an S-E-I-R model, which is made up of compartments S, E, I, and R. Since we extended the built-in S-I-R model, we need to add a new E compartment.
- In the Visual Editor, click the Add Compartment button
-
- In the Add Compartment dialog, enter the following values
- Name: e (make sure this is lower case)
- Compartment Type: Standard
- Data Type: double
- Click Finish
- A new e box now appears in the diagram
- You may want to rearrange or resize the compartment boxes so that the S, E, I, and R boxes are in order (easier when connecting the compartments)
- To rearrange, select a compartment and drag it to a new location
-


That's it. You've added a new compartment to your model. This is now a S-E-I-R model.
Add New Model Parameter
In addition to inheriting compartments from the parent SIR model, the new model also inherits the model (or rate) parameters from SIR. Inherited parameters include Transmission Rate (transmissionRate), Recovery Rate (recoveryRate), Immunity Loss Rate, etc.
We already added the new Exposed state to the disease model. In the textbook SEIR example, the rate controlling movement from the E to I compartments is the Incubation Rate. The next step is to add the incubationRate model parameter to the MySEIR model.
- In the Visual Editor, click the Edit Model button
-
- In the Edit Model dialog, click the Add Parameter button
- In the Edit Parameter dialog, enter the following values:
- Name: incubationRate
- Display Name: Incubation Rate
- Data Type: double (default)
- Default Value: 0.0 (default)
- Optionally, add a minValue constraint of 0.0
- Click OK to add the parameter
-
- Click OK again to apply the changes

Regenerate the Model Project
Changing a model's parameters or compartments requires a Model Regeneration. This operations rebuilds several of the key Java files that make up the structure of your model project. For more information, see the section on Model Regeneration.
To run the Model Generator:
- In the Visual Editor, save the MySEIR model
- Click the Model Generator button in the Visual Editor Toolbar
-
- If prompted, save the model file
- In the Model Generator wizard, immediately click Finish
- Wait while the model is regenerated
- This may take up to a minute to complete
After the Model Generator wizard closes, you're ready to implement the model's transitions and expressions.
Create Transitions and Expressions
Now that the initial setup is finished, you're now ready for the fun part - creating the Transitions that describe the movement of a population between compartments in the disease model.
Transitions have four pieces:
- The source compartment
- The target compartment
- The equation that describes the flow rate out of the source compartment and into the target compartment per time step
- The list of incidences the transition counts toward
With the Visual Editor, you can easily draw the transitions as directed graph edges between a source and target compartment then use the STEM Expression Editor to enter the rate equations.
Draw Transitions
For the MySEIR model, we will create transitions between these compartments
Source Target Transition s e S → E e i E → I i r I → R i diseaseDeaths I → diseaseDeaths r s R → S
To draw transitions:
- In the Visual Editor, select the Draw Transition Tool button
-
- To create the S → E transition:
- Select the S compartment as the source. Click once on the s compartment box
- Select the E compartment as the target. Move the mouse to and click once on the e compartment box
- You should now see a directed connector between the s and e compartment boxes
-
- Repeat for the other transitions listed above
- After you create all five transitions, your diagram should look like this:
-


Enter Rate Equations
For our MySEIR model, the next step is to enter the equations for the five transitions we created in the previous step.
Using the Expression Editor , you can easily enter the equations that represent the state changes in your model as STEM Expressions. For more information, please read about the STEM Expression Language and the Expression Editor.
- In the Visual Editor, select the Chooser tool in the toolbar
-
- Select connector edge between the s and e compartment boxes
- In the Expression Editor , enter the equation expression
- Note: The final statement starts with the word delta and end with a semicolon ( ; )
- For S → E, enter:
-
delta transmissionRate*S*effective(i);
-
- Tip You can use auto-completing expression assistance as you enter your expression. Just type Control - S as you type for the assistance dialog!
- For S → E, select the box next to incidence under For Incidence
- This tells the STEM simulation engine to count this transition as part of the disease incidence
- Repeat these steps for the other transitions in the model, entering these expressions for the transition:

Transition Expression Incidences to select S → E delta transmissionRate*S*effective(i);incidence E → I delta incubationRate*E;none I → R delta recoveryRate*I;none I → diseaseDeaths delta infectiousMortalityRate*I;none R → S delta immunityLossRate*R;none
Save your Model
Before you continue, be sure to Save the model. This will tell STEM to generate the Java code that implements your disease model and install it into the STEM application.
To save the open model in the Visual Editor, either do Control - S ( Command - S on Mac OS X) or open the File menu and select Save.
Summary
That's it! You've now created a simple, textbook S-E-I-R disease model using the STEM Model Creator. In the next section/tutorial, you'll learn how to use the new model in a STEM simulation.
Tutorial 2: Run a Disease Simulation using the MySEIR model
Getting Started
In the previous tutorial, you used the STEM Model Generator to create and build a fully functional SEIR disease model in STEM. You're now ready to run your new MySEIR disease model in STEM. If you're new to STEM, at this point you may want to look through the STEM Scenario guide to understand how STEM scenarios, models, and simulations work.
To simplify this tutorial, we've provided a simple demo scenario project with pre-built scenarios, geographic models, infectors, innoculators, and sequencers. In this tutorial, we'll import the project into STEM, create a new disease instance of your MySEIR disease model, add the disease to a geographic model, and run a STEM simulation.
Download and Import Demo Project & Scenario
The first step is to download the VisualEditorDemo project and import it into STEM
- Download the Visual Editor Demo project zip file
- In the STEM application, open the File menu and select Import
- In the Import Wizard, under General, select Existing projects into Workspace
- Click Next
- Click the radio button next to Select Archive File
- Click Browse and navigate to the location you downloaded ZIP file
- Select VisualEditorDemo.zip and click Open
- Verify VisualEditorDemo is listed under Projects
- Click Finish
- The VisualEditorDemo project should now appear in the Project Explorer
-

Create MySEIR Disease
Next, we want to create an instance of our new MySEIR disease model.
- In STEM, open the New menu and select Disease
- You can also click the New Disease icon in the toolbar
-

- In the New Disease wizard, make sure VisualEditorDemo is the selected project
- For Name, enter SeasonalFlu
- From the Disease Model drop-down, choose MySEIR (probably at the bottom of the list)
- For Disease Name, enter flu (lower case)
- Enter appropriate rate parameter values. For this demo, here are some suggestions:
- Transmission Rate: 1.2
- Infectious Recovery Rate: 0.3
- Immunity Loss Rate: 0.05
- Incubation Rate: 0.5
- All others: defaults
- Click Finish to create the new disease

Add Disease to Geographic Model
Next, we'll add the new Disease to the pre-built geographic model.
- In the STEM Project Explorer, expand the VisualEditorDemo project
- Expand the Models folder. Double-click on CubaDisease.model
- The CubaDisease.model editor should open
- In Project Explorer, expand the Decorators folder
- Select My SEIR flu, drag and drop into the CubaDisease.model editor root
-
- Save and Close the CubaDisease.model editor

Launch the Scenario as a STEM Simulation
You're finally ready to see the results of all the work. You will now launch the pre-built scenario as a STEM simulation and observe the epidemic curve as a time series chart.
- In the Project Explorer, expand the Scenarios folder
- Right Click on CubaDemo.scenario and select Step
- This will launch a simulation and open the Simulation perspective
-
- On the Graph Map, double click on the Cuba polygon to open a Time Series tracker
- Under Simulation, click the Run Button
 to start the simulation
 - Wait while the simulation runs, watching the Time Series view of the epidemic curve
-
- Your time series plot should look like this:
-
- When the simulation finishes, you can click the Stop Button


Summary
You're finished! You've successfully authored a simple, textbook SEIR disease model, created a disease instance in STEM, and run a simple spatiotemporal simulation. Obviously this is not a real-world example, but it's a good introduction to using the STEM Model Creator, Visual Editor, and Expression Language to easily author compartmental models of disease.
In the next tutorial, you will build on this existing model to add more complicated features, such as sinusoidal and temperature forcing to create a seasonal variation in your disease model.
Tutorial 3: Add seasonal modulation to the SEIR model
Getting Started
In this tutorial, we are going to extend the MySEIR disease model previously created to add a seasonal modulation to transmission. We will create two different modulations - one using a sinusoidal function and then one that uses the STEM Earth Science data to be temperature-dependent.
Sinusoidal
In this example, we'll add a Modulation Period parameter to the MySEIR then use the built-in sin(...) function to apply a sinusoidal modulation to the transmission rate.
If you've previously closed the Visual Editor, reopen the MySEIR model
- In the Project Explorer expand com.example.diseasemodels.demo project
- Expand the model folder
- Double click on demo.metamodel to open the Visual Editor
- Add the Modulation Period parameter (Adding a model parameter)
- Name: modulationPeriod
- Display Name: Modulation Period
- Data Type: double
- Default Value: 365.25 (one year)
- Add a minValue constraint of 0.0
- Remember to run the Model Regenerator
- Select the S → E transition
- In the Expression Editor
- First add a seasonalModulation local variable
-
seasonalModulation = 1+sin(2*3.14*t/modulationPeriod);
-
- Then add the seasonalModulation to the expression delta:
-
delta transmissionRate*S*effective(i)*seasonalModulation/2
-
- First add a seasonalModulation local variable
- Final expression should look like:
-
- Save the MySEIR model
- Now re-run the CubaDemo.scenario simulation to see the change in the Time Series graph
-


Temperature-dependent
Next you're going to change the seasonal modulation from a sinusoidal function to be temperature-dependent. To get temperature data, you'll use the temperature() function that comes with the STEM Expression Language. The temperature() function uses the STEM Earth Science data applied to each region in your geographic model.
To access temperature data, you must first:
- Install the Earth Science Add-on into STEM
- Add the Earth Science data labels to your geographic model
- In our VisualEditorDemo project, this the data is already added to the Germany model
Next change the expression to add the temperature() function
- In the Visual Editor, select the MySEIR model
- Select the S → E transition
- In the Expression Editor, change the expression to:
-
seasonalModulation = max(temperature()/10,0); -
delta transmissionRate*S*effective(i)*seasonalModulation;
-
- This is what the expression should look like:
-
- Save the MySEIR model
- In the Project Explorer, expand the VisualEditorDemo project
- Under models, open GermanyDisease.model
- Drag and drop the MySEIR flu disease into the GermanyDisease.model root
- Save and Close the GermanyDisease.model editor
- Next, under Scenarios, right click on GermanyDemo.scenario and select Run
- In the Simulation perspective, double click on one of the Germany regions to add a Time Series tracker
- You may need to restart the scenario after this
- After the simulation finishes, you should see a Time Series that looks like this:
-


Summary
You've now successfully modified a textbook SEIR model to add a simple seasonal modulation. At this point, you can now begin exploring how to use the STEM Model Creator and Expression Language to tackle more sophisticated disease models.
More tutorials will be coming soon!