Notice: This Wiki is now read only and edits are no longer possible. Please see: https://gitlab.eclipse.org/eclipsefdn/helpdesk/-/wikis/Wiki-shutdown-plan for the plan.
VIATRA/Query/UserDocumentation/DebuggerTooling
The VIATRA Query debugger tooling aims to provide useful functionalities for the users, so that they can easily observe the contents of the VIATRA Query related artifacts when the program execution has stopped at a breakpoint. The plan is to provide three kinds of support for debugging:
- Possibility to explore the contents of the EMF instance models
- Navigation in the contents of VIATRA Query pattern matcher engines (matchers, matches, match parameters, etc)
- Navigation in the contents of VIATRA Query Rule Engines
The idea was described in the corresponding Bugzilla issue https://bugs.eclipse.org/bugs/show_bug.cgi?id=405556.
The 0.8 version of VIATRA Query introduces support for the second point, the other two points will be implemented later. The debugger tooling is seamlessly integrated into the Eclipse Debug Perspective with additional views for the mentioned functionalities.
The features will be described with the emfxcel example (which is described in more details here http://viatra.inf.mit.bme.hu/incquery/examples/emfxcel). The example can be obtained from the GitHub repository https://github.com/ujhelyiz/EMF-IncQuery-Examples/tree/master/emfxcel.
Debugging VIATRA Query engines
- The latest version of VIATRA Query provides a new view which is called VIATRA Query Variables. This view is similar to the original Variables View (from the Debug Perspective), except that this one will display VIATRA Query pattern matcher engines when the application has halted at a breakpoint.
- In this example we will place the net.istvanrath.emfxcel (note that this one will generate two additional plug-ins) and net.istvanrath.emfxcel.editor.xlsx plug-ins into the host Eclipse. Take these plug-ins and add them to an Eclipse Application Launch Configuration and start this configuration in Debug mode.
- We will place a breakpoint at the LoadResourceSetHandler#execute method, which will be invoked when a new EMF instance model is loaded into the Query Explorer. If we place the breakpoint on the return statement, then by the time the execution gets there, the engine will already be created and we can see it in the Variables view.
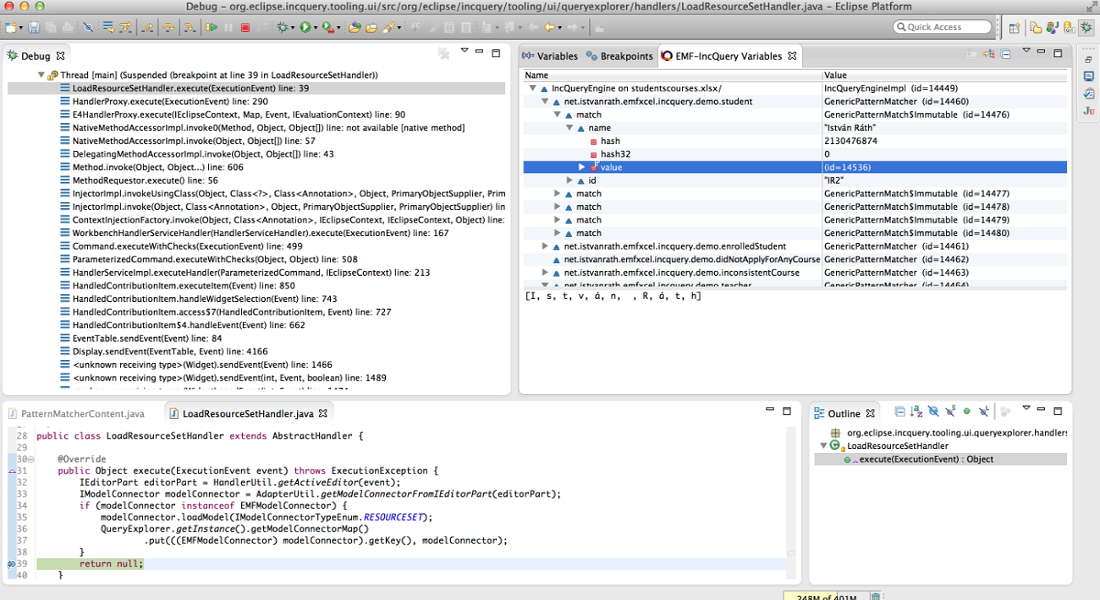
- Load the StudentCourses.vql and studentcourses.xslx files (in this order) into the Query Explorer. Once you have loaded the EMF instance model (the excel sheet in this case), the execution will immediately halt at the breakpoint that we have just specified and the control will jump to your host Eclipse. Note that, you could have loaded the files in the other order, but then you would not have any matches right at the first time when the execution stops at the breakpoint.
- You will see similar contents in the Variables View, just as it can be seen on the screenshot below. You can browse the contents of the engines through the hierarchy engine -> matcher -> match -> match parameter -> original content. Here original content means that under the match parameters you can browse the contents as it would be displayed in the original Eclipse Variables View for the given object. On the screenshot you can see the details for a String literal (hashCode, value, etc), but other kinds of objects are displayed in the usual form too.

- Upon debug events (stepping, returning) the contents of the view will be updated so that the variables reflect the changes that have happened in the JVM. If you let your application run again, then the contents of the view will be cleared out just like for the original Variables View.
Additional remarks
- If you are repeatedly loading and unloading EMF instance models in the Query Explorer, you may see an already unloaded engine in the Variables View. This can be due to the fact that the garbage collector has not yet collected the engine instance.
- If you are using the Variables View for an Eclipse application then you should remember that you need your plug-ins on "three levels". On the first (bottommost) level are the core VIATRA Query plug-ins, containing also the plug-in for the debug support. The Variables View is then loaded into the second level, and this is the level where it will be populated with the variables. The contents, however, will come from the third level, where your application is running. This has some important implications:
- The JVM on the second level needs to collect information from the JVM on the third level. This information is collected with the Java Debug API (http://docs.oracle.com/javase/7/docs/technotes/guides/jpda/)
- If you have installed VIATRA Query into your host Eclipse, then it is enough to use "two levels", because the Variables View will be loaded into the host Eclipse.
- If you are using VIATRA Query with an OSGi application, then you can use the Variables View on the same level as your application.
