Notice: this Wiki will be going read only early in 2024 and edits will no longer be possible. Please see: https://gitlab.eclipse.org/eclipsefdn/helpdesk/-/wikis/Wiki-shutdown-plan for the plan.
Difference between revisions of "Profiling with TPTP - plug-in development"
(→Thread Analysis) |
(→Execution Analysis : Identify a bottleneck) |
||
| Line 29: | Line 29: | ||
== Execution Analysis : Identify a bottleneck == | == Execution Analysis : Identify a bottleneck == | ||
| − | + | TPTP provides tools and views to help identify execution bottleneck problem, please take a look at [[Execution Analysis]] for more information. | |
| − | + | ||
| − | + | ||
| − | + | ||
| − | + | ||
| − | + | ||
| − | + | ||
| − | + | ||
| − | + | ||
| − | + | ||
| − | + | ||
== Memory Analysis : Identify a memory leak == | == Memory Analysis : Identify a memory leak == | ||
Revision as of 09:16, 8 October 2008
Contents
Overview
- This page shows how to quick start a profiling session on a plug-in project. TPTP must be installed on an Eclipse workbench, for more information on installation, please read Install TPTP with Update Manager.
Profile a plug-in project
- 1. Select a plug-in project and select Profile As > Eclipse Application.

- 2. In the profile configuration dialog, under Monitor tab, select Java Profiling agent and select Edit Options.

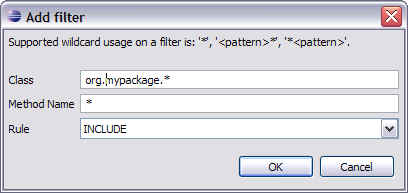
- 3. In Filter page, add a new filter.

- 4. Input a new filter that includes your plug-in packages. eg.,
- sample.myplugin* * INCLUDE

- 5. Click Finish to apply filter.

- 6. Click OK to start profile session.

- 7. Select Yes to switch to profiling perspective upon request.

- 8. Profiling resources (process, agent, and analysis type) are created in Profiling Monitor view.

- 9. Interact with your Run-time workbench for profiling agent to collect profiling data.
- 10.In the development workbench, double-click on an analysis type to open a profiling view to show profiling data collected.

- 11.In profiling table view, select any column header to sort the table.

Execution Analysis : Identify a bottleneck
TPTP provides tools and views to help identify execution bottleneck problem, please take a look at Execution Analysis for more information.
Memory Analysis : Identify a memory leak
Memory leak problem can be identify with the help of Memory Analysis. Memory Analysis can be enabled in the launch configuration by selecting Memory Analysis type of a Java profiler.

If allocation detail information is required, enable the Track Object Allocation Site option in the Edit Option detail of the analysis type.

Double-clicking on the profile agent opens the Memory Statistics view which shows memory related information of an application under profiled.

Selecting any class instance in the table and switch to the Allocation Details tab gives more information about the allocation of the selected class. Note that allocation details is available only when Track Object Allocation Site option is enabled in the profile configuration.

In the view, array information is also traced. They are shown as type[] for array or type[][] for two-dimensional array and so on.

Thread Analysis : Identify threading problem
Thread or job problem can be identify with the help of Thread Analysis. Thread Analysis can be enabled in the launch configuration by selecting Thread Analysis type of a Java profiler.

If contention information is required, enable the Contention Analysis option in the Edit Option detail of the analysis type.

Double-clicking on the profile agent opens the Thread Statistics view which shows thread related information of an application under profiled.

Selecting any thread instance in the table and click Show Call Stack button opens Call Stack view that shows stack information of the selected thread.

More detail information can be acquired by switching to the Monitor Statistics tab which shows information of class monitored in each thread.

The Threads Visualizer tab shows a graphical representation of the thread analysis, Legend is available in the Legend button.

Mouse over any thread in the view shows details about the selection.
