Notice: This Wiki is now read only and edits are no longer possible. Please see: https://gitlab.eclipse.org/eclipsefdn/helpdesk/-/wikis/Wiki-shutdown-plan for the plan.
Linux Tools Project/PERF/User Guide/Comparison Feature
Contents
Profiling Comparison
All the profiling information that is displayed when using the Perf plug-in is recorded in auto-generated perf.data files. The Perf plug-in allows you
to compare two perf.data files, providinga visual representation of the differential result.
Locating Perf data files
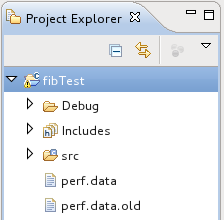
The most recent Perf data files, namely perf.data and perf.data.old, are located under the project's root folder by default. However, any perf.data
files available in the project explorer can be selected for comparison.
Selecting Perf data files
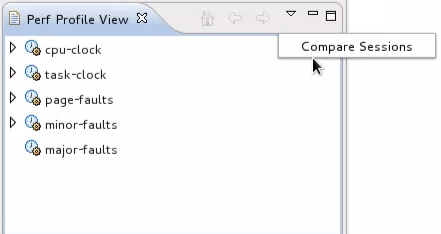
To select the data files that will be compared, click on the downward arrow in the actions menu and select "Compare Sessions".
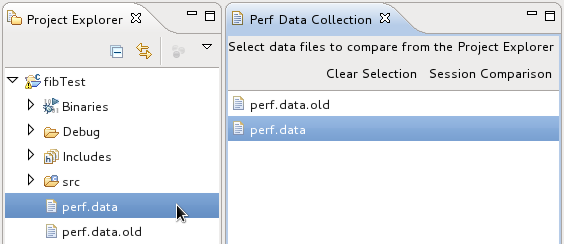
This will bring up a view that will be updated whenever a perf data file is selected from the project explorer. Old perf data files should be
selected first for accurate results.
Comparing Perf data files
To compare the selected data files, click on the "Session Comparison" option
in the action menu.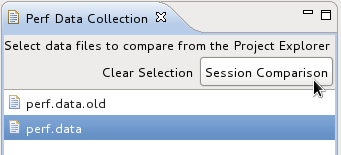
This will display the results of the comparison.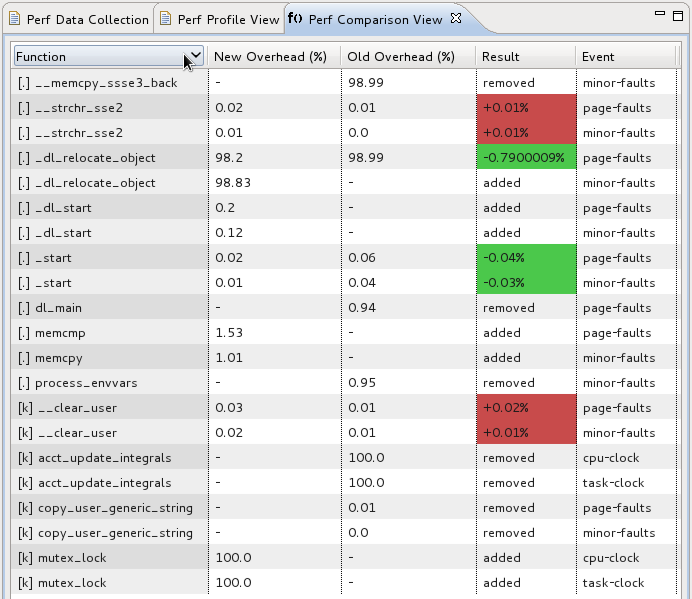
Perf Comparison View:
The table displayed above describes the result of the comparison in the following manner:
- Function: Name of profiled function
- New/Old Overhead: Percentage of the overall samples collected in the corresponding function, corresponding to respective Perf data files
- Result:
- removed: Function was removed in most recent profiling.
- added: Function was added in most recent profiling.
- +/- percentage: Gain/Loss in overall samples collected in corresponding function.
- Event: Event function corresponds to.

