Notice: This Wiki is now read only and edits are no longer possible. Please see: https://gitlab.eclipse.org/eclipsefdn/helpdesk/-/wikis/Wiki-shutdown-plan for the plan.
LDT/User Area/User Guides/User Guide 1.2
Contents
Overview
The Lua Development Tools (LDT) project provides plug-ins that implement a Lua IDE supporting the development of Lua scripts and applications. It adds a dedicated Lua perspective to the Eclipse Workbench, which, together with features such as syntax highlighting, scope-aware code completion, code folding, etc. which allows to structure Lua application better (project-based organization), and boosts the productivity of Lua developers.
Getting started
Create a project
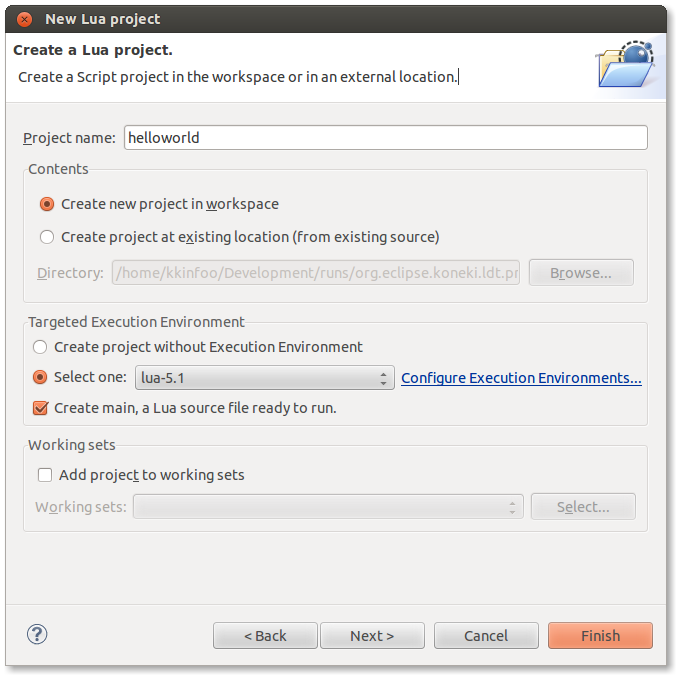
For your code to be manipulated correctly by Lua Development Tools, it must be contained into an Eclipse project having a Lua flavor. In order to do this, you have to create a Lua Project, which will add Lua nature to your code.
In File > New > Lua Project, enter a valid name and voila!
Edit a Lua file
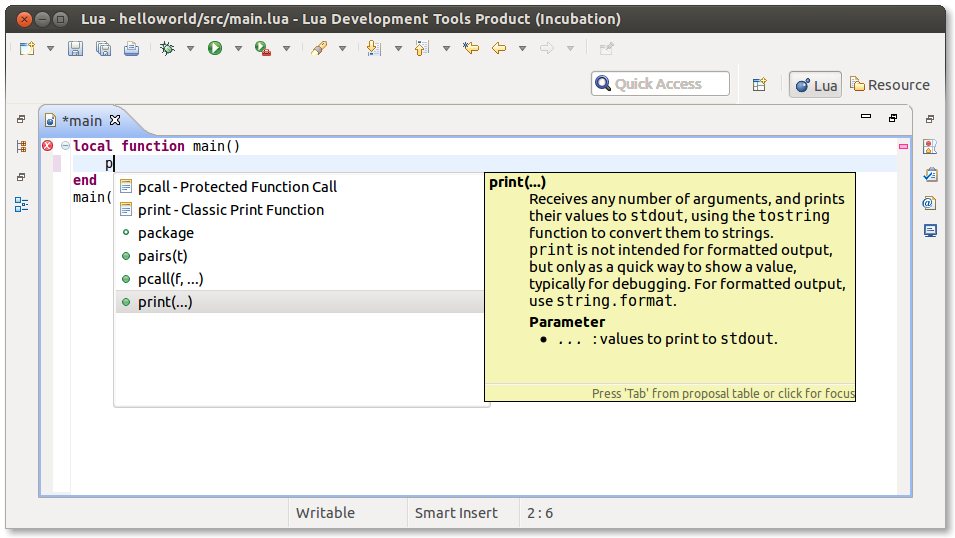
Now that your project is created, you are ready to start working on your Lua scripts. In every project, there is a default source folder, named src/. You can edit the main.lua file in it, notice that completion is already available for Lua built in functions.
Run a Lua script
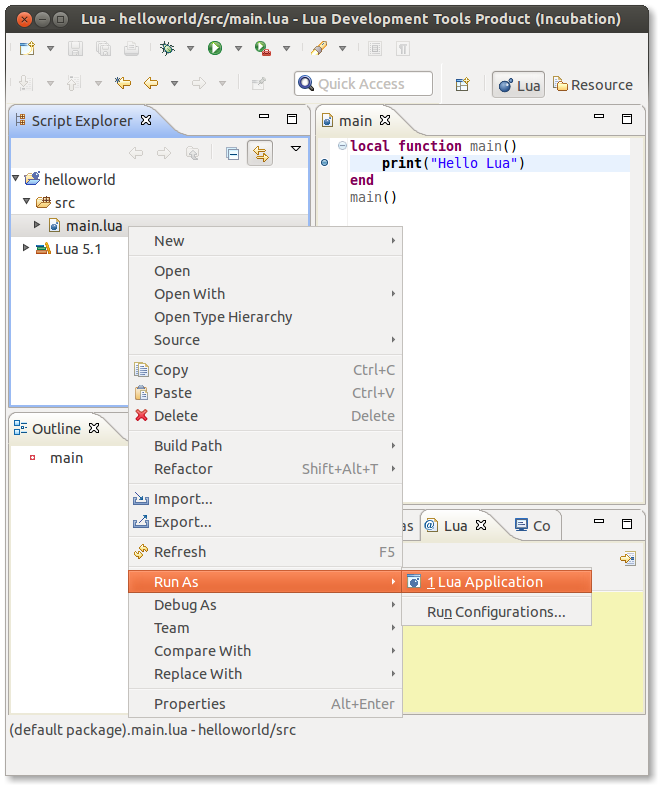
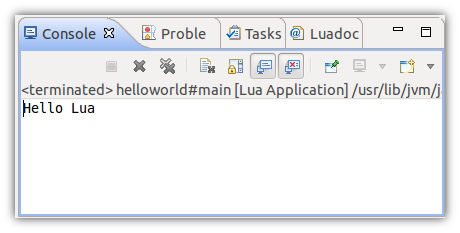
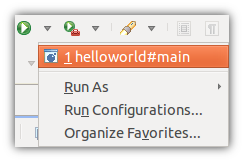
To run your Lua script, the file has to be contained in a Lua project. If it is the case, you can simply right click on the file and select Run As > Lua Application.
The Run As menu creates a default launch configuration for the selected file and launch it.
Debug a Lua script
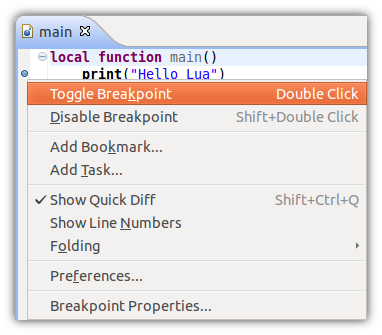
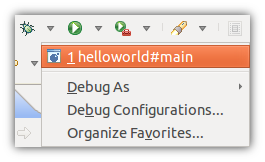
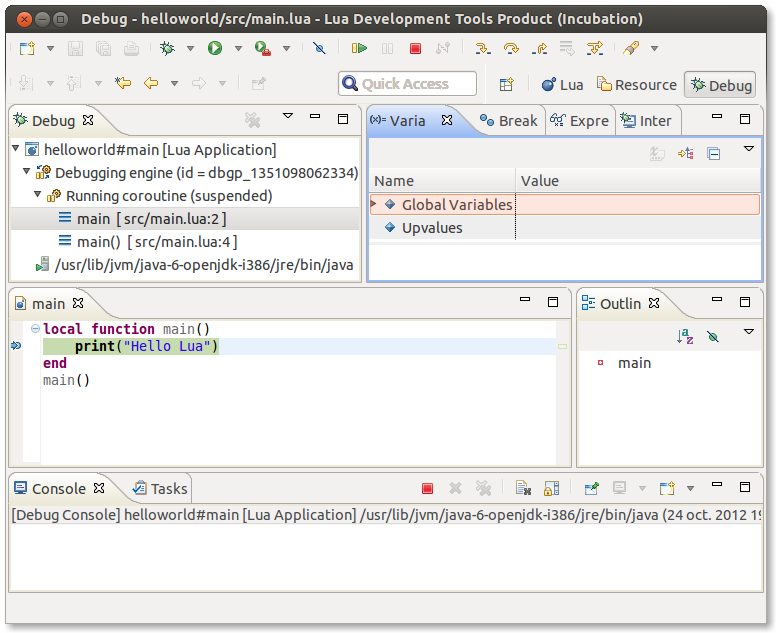
Simply define a breakpoint in a Lua file by right or double clicking in the first column at the beginning of the line. Select your project in favorite debug sessions and your breakpoint should be hit.
Concepts
Before diving into concepts of LDT, you may need more information about the concepts of Lua itself. In this case, you are highly encouraged to refer to the Lua manual.
Buildpath
It is a set of folder paths which contains sources and libraries accessible from your project. There are several kinds of them:
- Project dependencies
- Source folders
- Execution Environments
Some elements like source folders and project dependencies are used for tooling and runtime purposes. Some others, are used only for tooling purposes, such as Execution Environments and .doclua files.
About runtime , source folders of current project and the ones of projects on which it depends will be appended to LUA_PATH at-once. At runtime, only .lua files are taken in account.
About tooling, all .lua and .doclua files from buildpath are parsed in order to enable some features of the IDE such as code completion, code navigation and TODO / Tasks.
You can require files from your source folders as modules. Lets say in a
src/ source path you have a foo.lua file, you can
write:
require 'foo'
This logic applies to sub directories, with a bar.lua file in
folder src/sub/, you can use:
require 'sub.bar'
The init.lua formalism is also handled. If you have an
init.lua file under directory src/bar/, you can write:
require 'bar'
Note: Source folders are important, as they are processed for tooling information. That is to say, if you write a module outside of a source folder , it will not be accessible from another module or script; thus, its content will not be available in e.g. code completion, documentation nor TODO/Tasks.
Execution Environment
An Execution Environment, is a file containing information about the environment where a Lua application is supposed to be run. An environment is a set of libraries and global variables available to the application out of the box, as in Lua 5.1 or MOAI SDK. Only one Execution Environment is expected per project.
The idea is to provide a file which describe elements of an environment. Provided information allows LDT to offer better code completion, code navigation and documentation layout.
An Execution Environment can contains:
- Description for globals and modules APIs with Lua Documentation Language which provides:
- code assistance
- documentation
- template files: Template of typical entry point for an application aiming this execution environment. Will be used to initialize new Lua projects.
- documentation: Environment documentation as HTML pages.
Manage Execution Environments
Get an Execution Environment
Create an Execution Environment
Interpreters
In our case, an interpreter is a program, a Lua Virtual Machine, that runs your Lua program. The most used in the Lua world might be Lua standalone interpreter. It is possible to run Lua application using interpreters from LDT. There is a JNLua based implementation available out of the box, but you can use your own.
Note: if you intent to debug with you own interpreter, you have to ensure that you have luasocket installed and available from your interpreter.
Manage interpreters
Debug an application using interpreters
Debug
Debug is a common way to monitor how your program behave at runtime, step by step. You can debug both programs that are running locally on your pc or on a remote one.
Local Debug
This is the typical use case, you monitor a program running on your desktop. Your application will be executed by an interpreter referenced in LDT. LDT will manage the LUA_PATH setting to allow the interpreter to access to all files in your buildpath.
Concepts Buildpath
Concepts Interpreters
Configure a Local Debug session
Attach Debug
You want to monitor an application running in a specific context that makes it impossible to be launched by LDT (for instance a Lua VM embedded in a larger C/C++ application). In that case, your application can connect to the IDE at startup and then be monitored.
This way of debugging is called attached debug, uses DBGp and is composed of two parties.
- DBGp Server: In our case it is LDT waiting for an application to connect.
- DBGp Client: In our case, it is the debugger.lua file executed in your debugged application which sends information about its run to LDT.
This way is more flexible, but you are on your own to manage the whole runtime configuration (LUA_PATH, debugger bootstrap, ...).
Configure an Attach Debug session
Source Mapping
The DBGp Server (IDE) has to know where to find the source files related to the debug information shared with the DBGp client (debugged application).
E.g. When you set a breakpoint, the IDE need to say to the running application on which file the breakpoint must be added.
E.g. When the running application stops on a breakpoint of a file, the IDE must retrieve the file and open it.
The problem is that the file executed in your Lua VM could be physically different than the source file in your IDE (in your workspace). For instance, the code may be executed on a different host or even just duplicated in another folder on the same desktop.
To solve this problem, LDT comes with several policies, each of them having its own pros and cons:
- Local Resolution
This way to resolve the source mapping is the simplest and the most reliable. Indeed the client and the server share the same absolute path for a given resource. This means that executed files should be in your workspace (more exactly, in the build path of your project) and you cannot use this policy to debug code running on a remote host.
- Module Resolution
In this case both the IDE and the application have their own way to retrieve a module from its name. The module name, and not an absolute path, is then used as the file ID. This policy can be used for a remote debugging session without having to set a list of path mapping. However it comes with some restrictions:
- Modules have to be loaded thanks to the LUA_PATH environment variable.
- Some conflicts in module name resolution may occur on the client side. Indeed module names are built from source paths returned by the Lua debug API (debug.getinfo) and the LUA_PATH that may be ambiguous.
E.g: with package.path = "/foo/bar/?.lua;/foo/?.lua" and debug.getinfo="@/foo/bar/baz.lua" the possible module name is bar.baz or baz
In that case the debugger will use the shorter one. Ideally ambiguous LUA_PATH shall be avoided when this policy is chosen.
- Replace path Resolution
This policy shall be used as a fallback in case the two previous ones do not fit. In this mode absolute paths are used on the client side and relative (to the project's build path) ones on the server (IDE) side. In order to achieve the translation between the two kinds of paths, the client resources root path has to be set in the launch configuration.
e.g: The root path "/foo/bar/" is set.
when an absolute file path is sent from the client (/foo/bar/baz/qux.lua), the root path is removed and a file with the resulting relative path (baz/qux.lua) is searched in the buildpath.
On the contrary, when a relative file path is sent from the server (baz/qux.lua),the root path is prepended to the path and the resulting absolute path (/foo/bar/baz/qux.lua) is used on the client side.
However this policy has some restrictions:
- The launch configuration is restricted to a single root path that has to be shared by all resources.
- All paths are case sensitive even on Windows operating systems.
- On Windows, root path has to be prefixed with "/" (e.g. /C:/foo/bar/).
In all cases, if a file is not found in the workspace, the source code is sent through the DBGp protocol
Configure an Attach Debug session
Remote Debug
The Remote Debug launch configuration enables the debugging of applications that run on remote systems. However these systems have to be Unix-like and allow SSH connections.
LDT will copy all the files in the project buildpath in the remote directory of your choice (default is /tmp), and will also manage the LUA_PATH setting allow the remote interpreter to access to those files.
Configure a Remote Debug session
Tasks
Configuring Build paths
See Buildpath.
Adding source folder
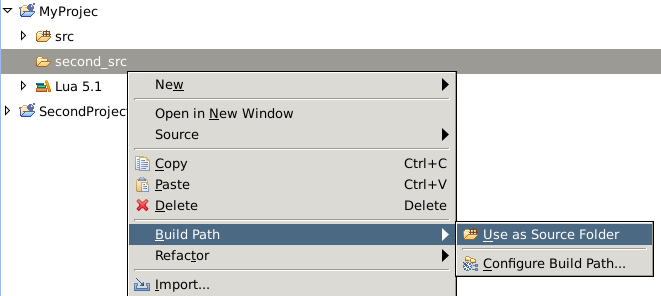
You can add a folder in the source path by right clicking on it and select BuildPath > Use as Source Folder
Adding project dependencies
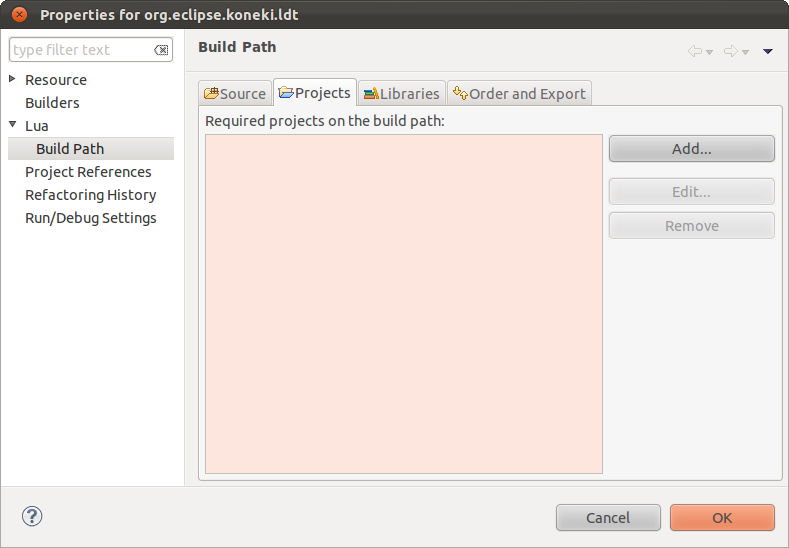
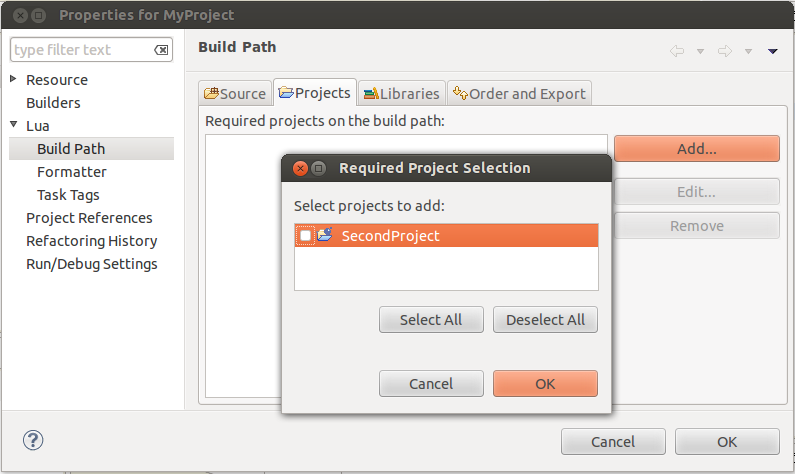
On the project o which you want to add a dependency, right click and selectBuild Path > Configure Build Path ....
Then select the Projects tab and use the Add button to create the dependency.
Managing Execution Environments
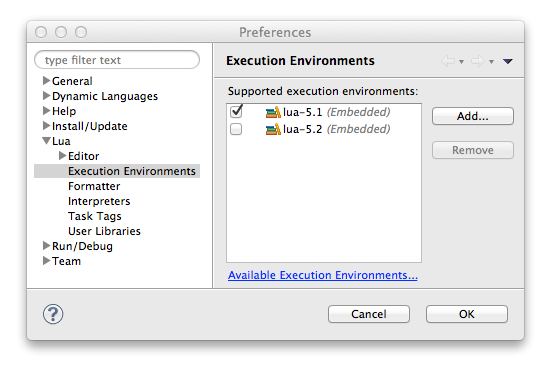
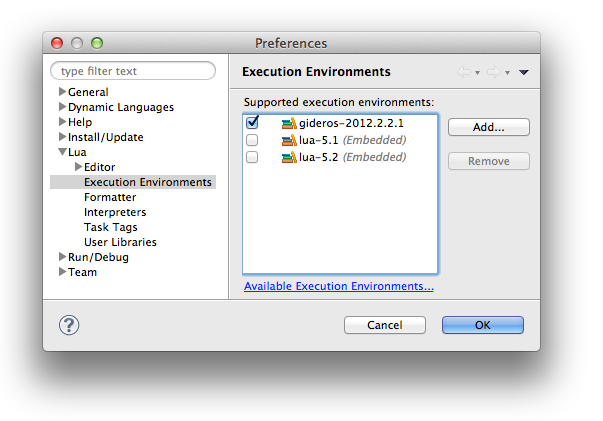
To find preferences related to Execution Environments, go to Window > Preferences > Lua > Execution Environments and you will have the following interface.
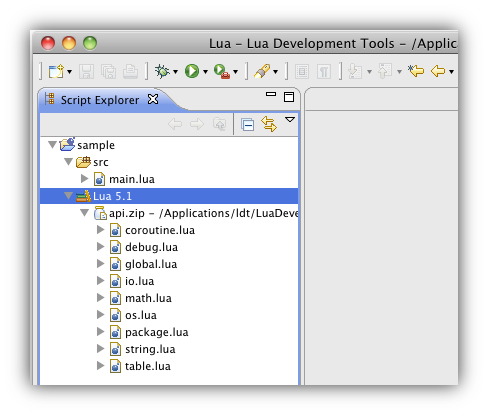
As you can see in previous screenshot, LDT is shipped with a Lua 5.1 Execution Environment. All Execution Environments shipped with LDT are suffixed by (embedded).
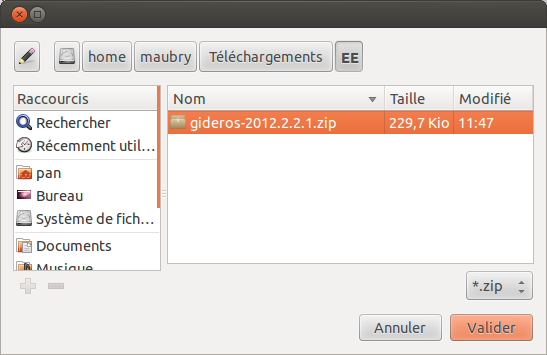
From here, is it possible to add an Execution Environment to current workspace. First, download an Execution Environment from the list of available Execution Environments or create your one Execution Environment. Then, back to the Execution Environments preference page, push Add button and select an Execution Environment file.
The Execution Environment is now available to use.
If you need to override an installed embedded Execution Environment, create a new Execution Environment with the same name and add it. All the projects using the embedded Execution Environment will automatically use the new one.
Link an existing project to an Execution Environment
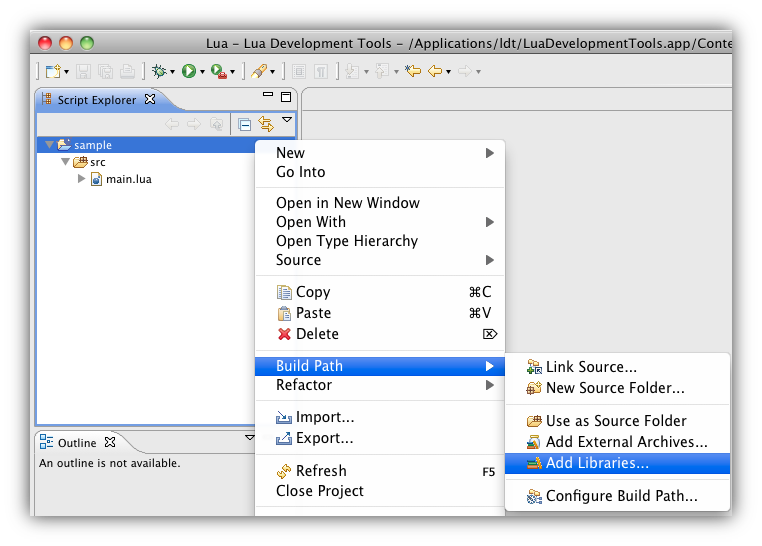
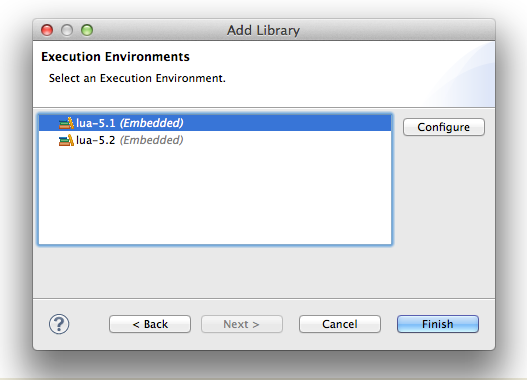
If you have created a project without Execution Environment, you can add one afterwards. Right click on a project and select Build Path > Add Libraries .... Be aware that only one Execution Environment is expected per project.
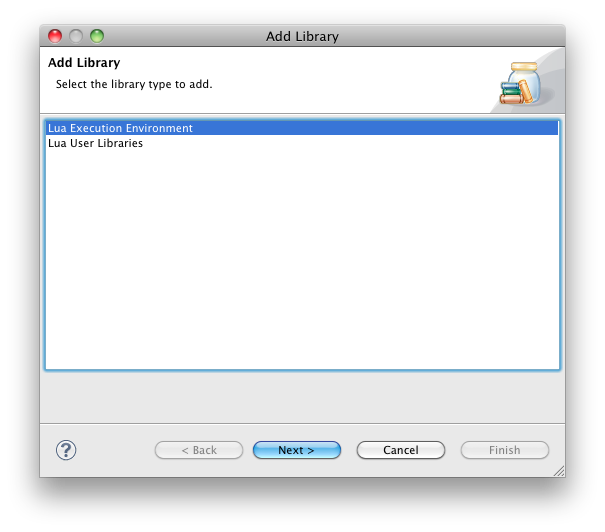
You will have to choose between several libraries types, choose Lua Execution Environment.
You can now choose among installed Execution Environments and press Finish.
It is now linked to selected project.
Managing Interpreters
Interpreters are used by LDT to run scripts on local computers, see Interpreters.
Embedded Interpreters
An embedded interpreter is an interpreter shipped with LDT. You can recognize them on the interpreter preference page, their location is mentioned as (embedded). Currently, LDT is shipped with the JNLua (Lua 5.1) embedded interpreter, JNLua is Java binding of Lua interpreter and APIs.
Local Interpreters
To run Lua scripts in LDT using the Lua Local Application launch configuration with a locally installed Lua interpreter, you have to configure a local interpreter. To configure an interpreter you just need the path of the interpreter executable, then you can set interpreter arguments and some environment variables.
See below how to reference a Lua interpreter installed on your machine, and use it in LDT.
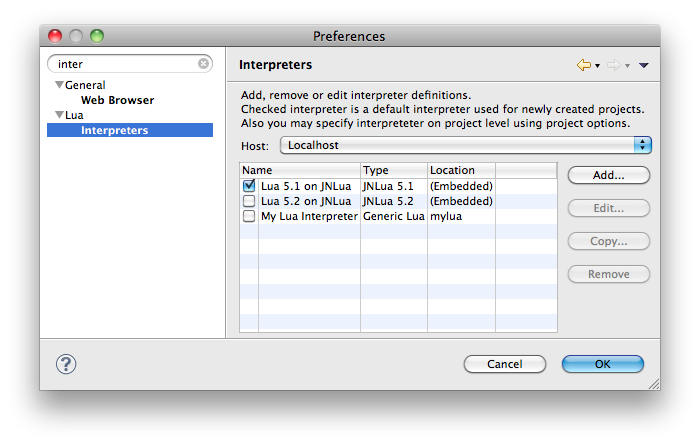
To open the Interpreters preference page go to Window > Preferences > Lua > Interpreters:
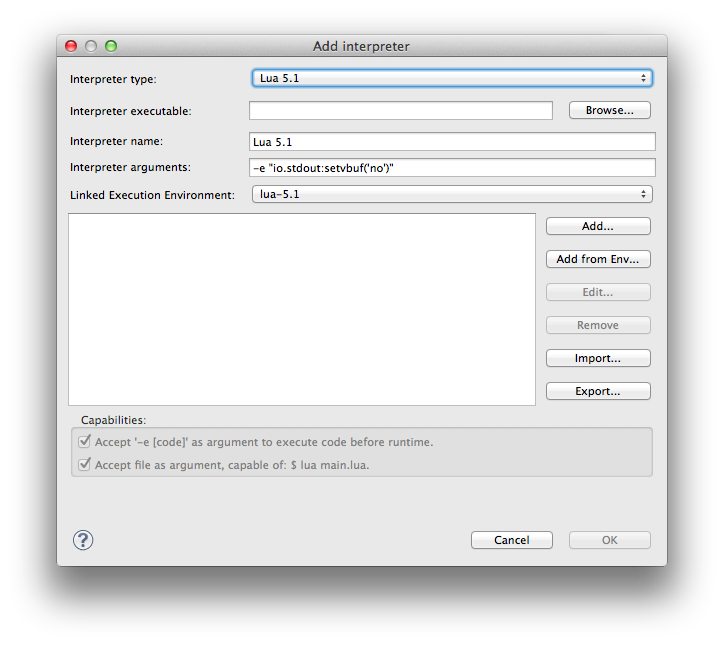
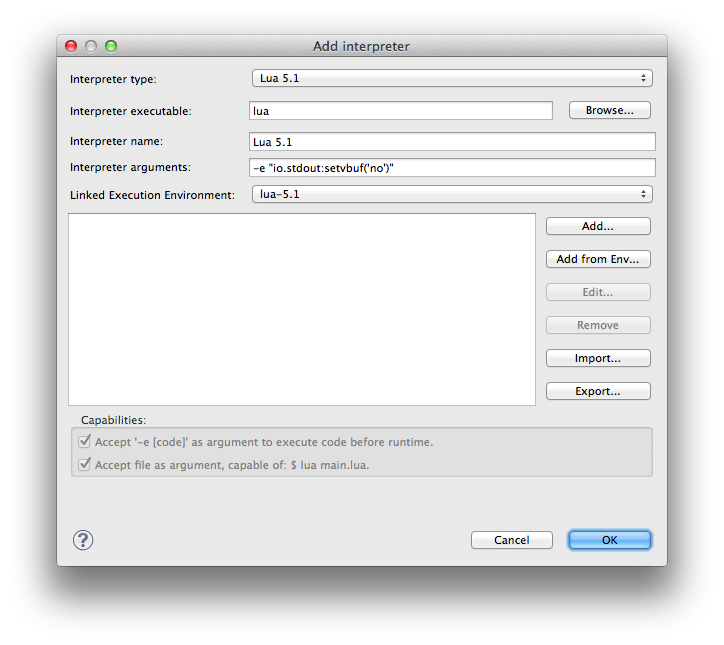
Then, press the Add... button to configure a new interpreter and fill in the fields as described here:
- Select one of the following interpreter type:
- JNLua 5.1 or JNLua 5.2 types for interpreters based on the LDT embedded JNLua interpreter.
- Lua 5.1 or Lua 5.2 types for standards Lua interpreters.
- LuaJIT 2.0 type for the Lua JIT 2.0 interpreter.
- Generic Lua type for interpreters who doesn't feet any other types.
- You can browse your file system and locate your interpreter executable, or if the executable is in your PATH environment variable, just type its name here (e.g.
lua). - Give a name to the interpreter (this is mandatory).
- Add extra interpreter's arguments if needed, the same way you would on a regular command line.
- Set environment variables for this interpreter. You can modify existing variables, or create new ones. Environment variables can be exported and imported using properties files.
- Set interpreter capabilities:
- Uncheck Accept -e [code] as argument if your interpreter doesn't accept the -e [code] option which execute the given code before the rest as the official Lua interpreter do. This option is used by the ide to launch the debugger, so if this option is unchecked your are responsible to launch the debugger by your own as explain in the configure debug session part.
- Uncheck Accept file as argument if your interpreter doesn't take the file to run as argument, this means that your interpreter have to run the Lua files by himself.
Once you press the Ok button, the created interpreter appears in the Interpreters page. The checkbox in front of each interpreter allows to check the default interpreter used in launch configurations.
Configuring debug sessions
See the explanation about the three way to debug in LDT.
Local session
According to your interpreter capabilities set in the interpreter preference if your interpreter doesn't handle the "-e" option. You have to launch the debugger by adding the following code :
if os.getenv('DEBUG_MODE') then require "debugger"() end
Note: The DEBUG_MODE environment variable is set only for debug, to avoid to start the debugger for a regular run.
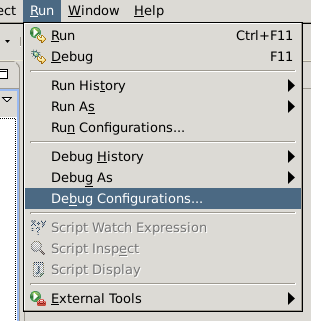
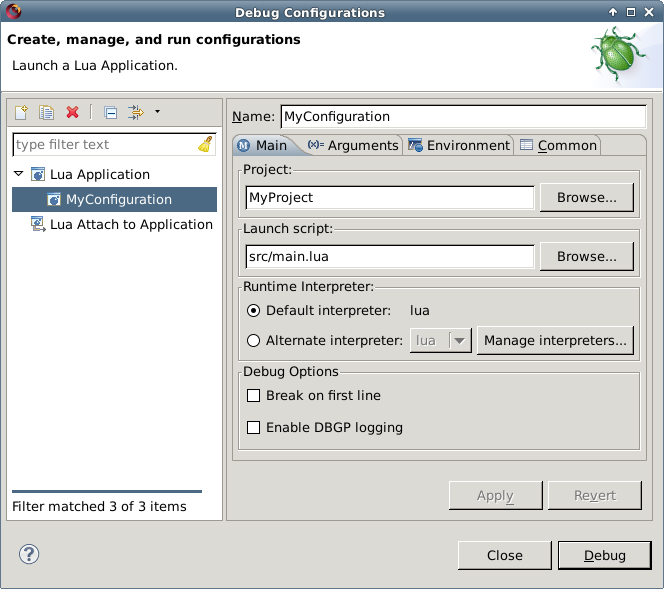
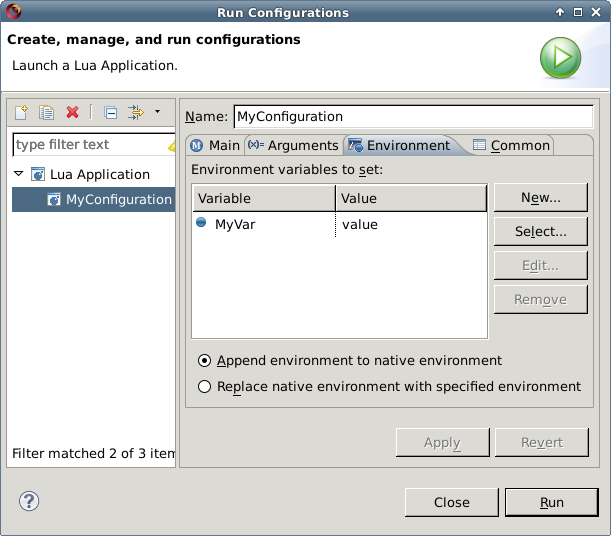
Create a Lua Application launch configuration in the Debug Configuration menu.
In the Main tab, you can select the project, the script you want to launch and a Lua interpreter.
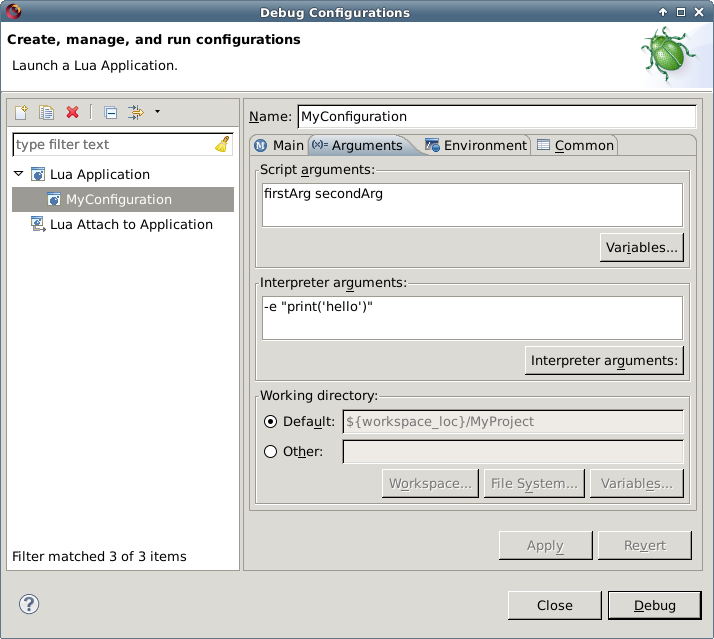
In the Arguments tab, you can specify interpreter arguments and script arguments. The interpreter arguments will be merged to the ones specified at the interpreter level (in the interpreter preference page) at runtime.
In the Environment tab, you can specify environment variables for runtime. Environment variable defined can be append
In the Common tab, you can set some settings related to launch configurations:
- Save current launch configuration in a specified file.
- See in favorite menu the launch configuration is displayed.
- Change the encoding of the launch configuration file.
- Allocate standard input/output in a console and/or redirect standard output in a file.
Attach session
The Debugger of Lua Development Tools is based on the DBGp protocol, and the IDE implements a DBGp server.
To connect to this server, and start remote/attach debugging, you need to use a DBGp Lua client.
Launching DBGp Client
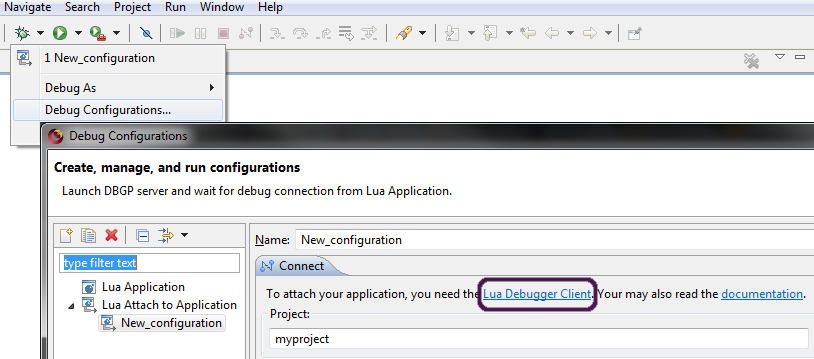
The DBGp Lua client is a Lua file which can be downloaded through the Lua Attach to Application launch configuration UI.
It runs on Unix-like OS and Windows (XP and later). It is written in Lua and depends on lua-socket.
You can get Lua at http://www.lua.org/download.html and install lua-socket thanks to luarocks, or via your official OS repositories.
If, for some reasons, you cannot use lua-socket, you could implement your own transport interface based on your own library (see the interface and the transport parameter)
To use it, you must have the debugger.lua file in your Lua path.
To begin the connection, you must execute this Lua code :
> local initconnection = require("debugger")
> initconnection(idehost, ideport, idekey,)
which can be shortened like this:
> require("debugger")(idehost, ideport, idekey)
- idehost: the host name or the IP address of the DBGp server (thus, of your IDE).
- if idehost is nil, the DBGP_IDEHOST environment variable is used.
- if the environment variable is nil, the default value '127.0.0.1' is used.
- if idehost is nil, the DBGP_IDEHOST environment variable is used.
- ideport: the port of the DBGp server (must be configured in the IDE).
- if ideport is nil, the DBGP_IDEPORT environment variable is used.
- if the environment variable is nil, the default value '10000' is used.
- if ideport is nil, the DBGP_IDEPORT environment variable is used.
- idekey: a string which is used as session key (must be configured in the IDE).
- if idekey is nil, the DBGP_IDEKEY environment variable is used.
- if the environment variable is nil, the default value 'luaidekey' is used.
- if idekey is nil, the DBGP_IDEKEY environment variable is used.
Advanced optional parameters :
- transport: the name of the module which implements the transport interface used to communicate with the server.
- by default the debugger use an internal implementation based on luasocket, but if you cannot use it, you can implement or use another transport layer implementation.
- if transport is nil, the DBGP_TRANSPORT environment variable is used.
- if the environment variable is nil, the default value 'debugger.transport.luasocket' is used : this is the default implementation based on luasocket.
- platform: 'unix' or 'win32' string which define the kind of platform on which the program to debug is executed.
- by default the debugger will try to guess it and often succeed. If for some reason it fails, you can help it by precising the execution platform.
- if platform is nil, the DBGP_PLATFORM environment variable is used.
- if the environment variable is nil, the debugger will try to guess it.
- workingdir: the working directory in which the program to debug is executed.
- by default the debugger will try to guess it and often succeed. If for some reason it fails, you can help it by precising the working directory.
- if workingdir is nil, the DBGP_WORKINGDIR environment variable is used.
- if the environment variable is nil, the debugger will try to guess it.
So, to debug any Lua script, you can do:
lua -e "require('debugger')('idehost', 'ideport');" MyApp.lua
or even just go with:
lua -e "require('debugger')();" MyApp.lua
If you want to rely on default values for the debug host and port (which should be 127.0.0.1:10000 if you didn't tweak any DBGP_* environment variable).
Console output- Some console output problems could happen because of buffer configuration. To force the stdout buffer to be flush at each call of print your should add this line:
- io.stdout:setvbuf("line"); or io.stdout:setvbuf("no"); see Lua documentation
- The full line should look like that:
- lua -e "io.stdout:setvbuf('line'); require('debugger')();" MyApp.lua
Setup DBGp Server
The DBGp Server is integrated in LDT.
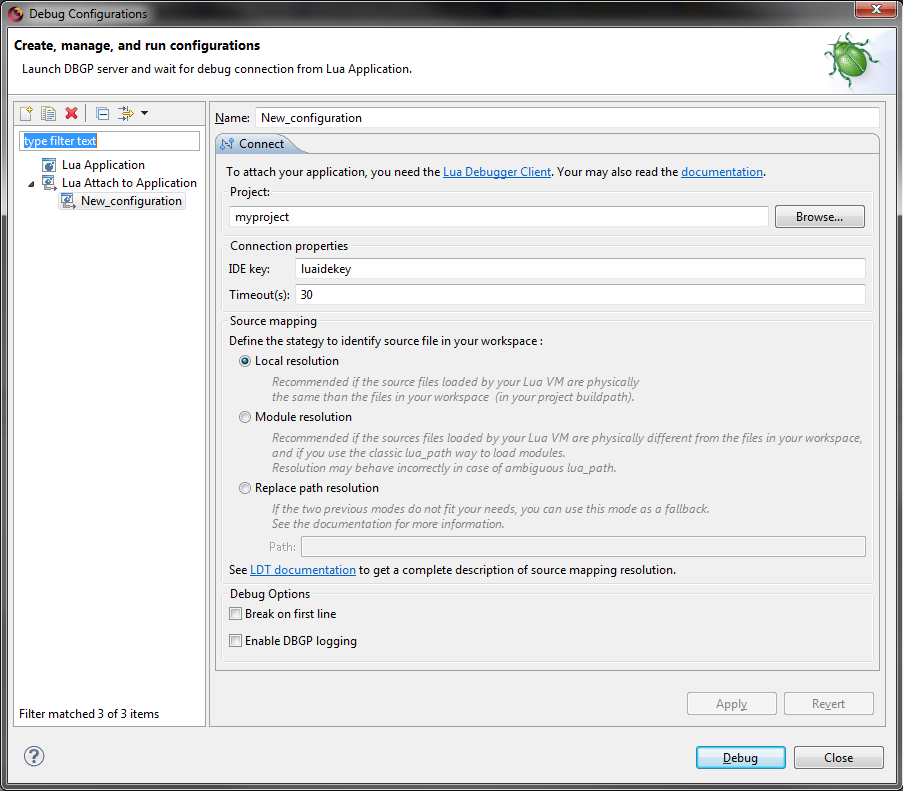
In order to accept incoming debug sessions, you must create a new Lua Attach to Application launch configuration, then launch it.
Go in Run/Debug Configurations....
- Project: select the LDT project in your workspace which includes the Lua source file(s) of the application you want to debug.
- IdeKey: default value is luaidekey, if you need to debug more than one application at the same time, you should change it to associate a launch configuration with only one application to debug.
- Source Mapping: Define a common way for DBGp Server (IDE) and DBGp Client (running application) to identify source file. There are several strategy, each one is more or less adapted to a specific use case. For better understanding, read the advanced documentation about it.
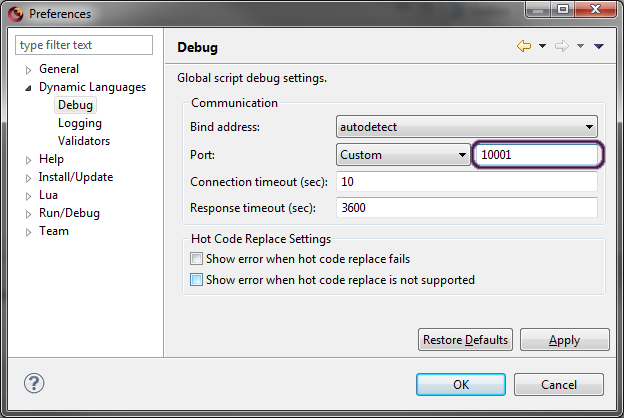
Now you can start your debug session by clicking Debug. IDE will wait for an incoming connection from the debugger client, on the port you can see in the debug view. By default, the port used is 10000, but if it is taken, another one may be used.
If needed, you can change the server port, in Window > Preferences > Dynamic Languages > Debug.
Remote session
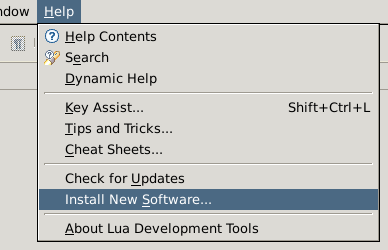
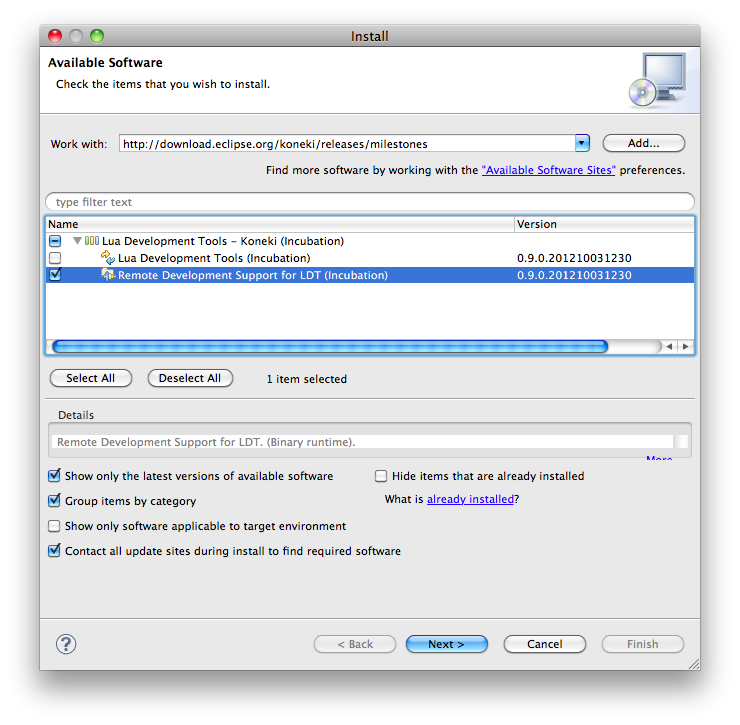
As the remote debugging is an advanced feature and is not required by most Lua developers. The remote debugging is not shipped with LDT and have to be downloaded and installed afterwards. To install the LDT remote feature, first select the top menu Help / Install New Software...
On the LDT update site select the remote feature in the list and install it. (see LDT update sites documentation)
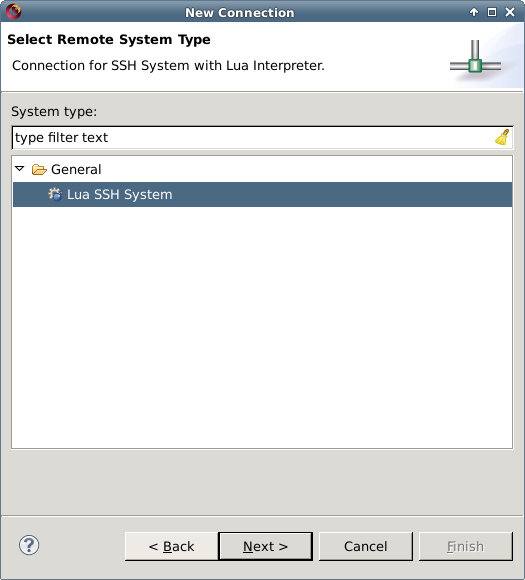
In the Remote System Explorer perspective, in the new wizard, create a new Connection and select the Lua SSH System kind of system.
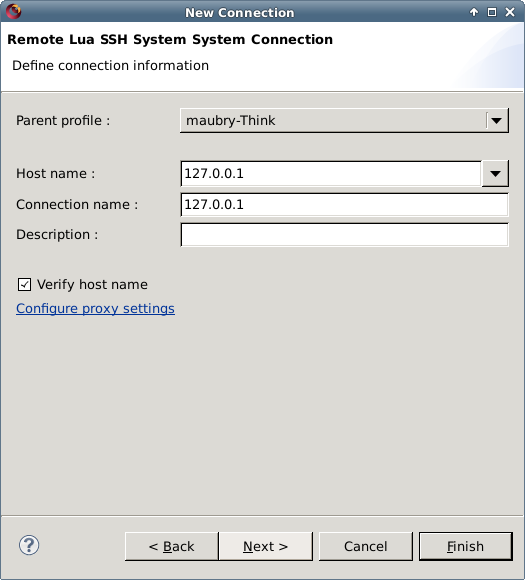
On the next page, enter the network name of your remote system, or directly its IP address.
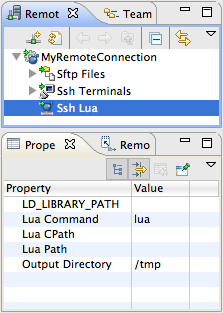
If needed, configure the runtime paths in ssh-lua sub-system advanced properties. If paths are not configured, the remote sytems's environment variables will be used. To change the properties, select the SSH Lua node of your connection. Then, in the property view bellow push the show advanced properties button. You can edit properties values by selecting the appropriate cell. If you let some properties empty, the remote system Lua defaults will be used.
User environment variable limitation:- LDT is not able to retrieve environement variables specified in the user scope. For exemple, if the variable LUA_PATH is modified in the .profile or .bashrc files of the remote user, on runtime theses modifications may not be taken into account.
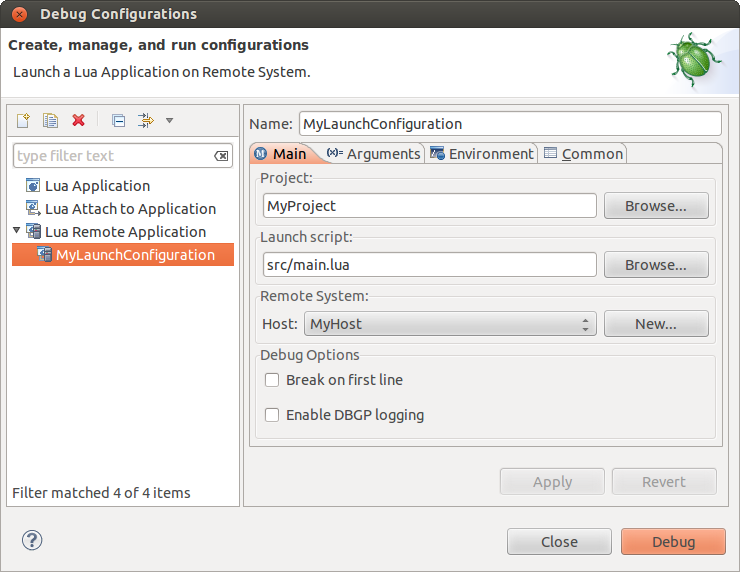
In the top menu, select Run/Debug Configuration....
Then, create a Remote Lua Application launch configuration. Configure the project and the script to run, also select the remote system.
The following tabs are also provided to configure your launch configuration:
- Arguments: you can here specify script and remote interpreter arguments, type the arguments as you would in command line. At the bottom of the tab, you can also edit the location where Lua files will be copied on the remote system, an absolute path is mandatory.
- Environment: Specify here some environement variables for runtime. Theses variables will be added to remote system's existing environement variables. As explained above, LDT is not able to retrieve environement variables values specfied in the user scope.
- Common: Some common launch configuration related settings.
- Save current launch configuration in a specified file.
- See current launch configuration displayed in favorite menu.
- Change the encoding of the launch configuration file.
- Allocates standard input/output in a console and/or redirects standard output in a file.
Launch the debug session, see how Debugging a Lua program to continue.
Debugging a Lua program
See how to launch debug in previous section called Configuring debug sessions.
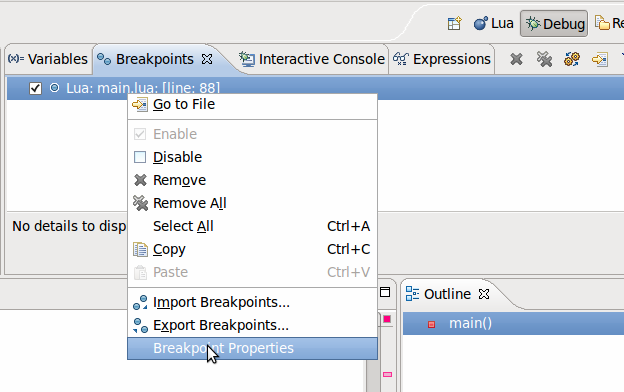
You can set breakpoints at a particular file or line, you can do it with the regular double-click on margin:
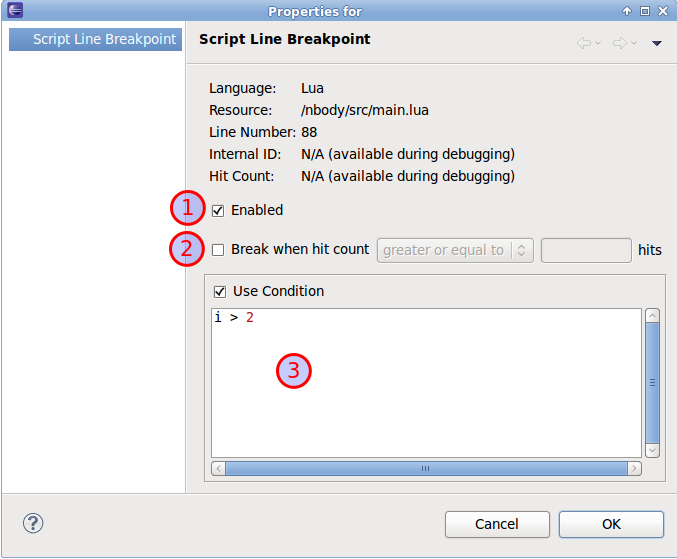
You can optionally indicate conditions to stop execution only under specific circumstances:
- Enables or disables breakpoint globally.
- Condition on hit count (stop only after the 3rd hit, every 4 hits, etc.).
- Conditional breakpoint: you can put any expression, it will be evaluated using the local scope every time the breakpoint is hit, and stop only when the expression evaluates to true.
Once a breakpoint has been hit, and the execution has actually stopped, you can use the Step Into, Step Over and Step Return commands.
Coroutine handling:- When the current instruction is a coroutine.yield or a coroutine.resume step over will jump over the coroutine until the next resume or yield whereas step into will go into the coroutine and re-break as soon as possible.}}
Environment inspection
When a breakpoint is reached, you can see any variable visible from any stack frame (local, upvalue and global variables). You can also edit values.
New values are expressions:- When you set a new value, it is evaluated as an expression, so math.sqrt will be evaluated to a function, if you want to put a literal string, use Lua syntax: "math.sqrt". In particular you can change an entire table by another table expression. This is sometimes powerful and sometimes dangerous, be careful.
Some special values can also be displayed such as metatables or function environments (if it is different from global environment). You can also edit them.
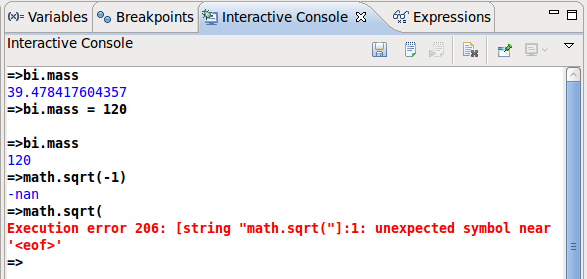
Interactive console and expressions
In addition to variable view, you have two other useful tools to evaluate some code snippets: expressions view and interactive console.
Always on top level:- Due to a limitation in the DBGp protocol, the interactive console and expressions are always mapped to the top stack frame.
Unsupported features
The dynamic code is not supported, it means that any code that is loaded with load, loadstring will not be supported. The debugger will step over it just like a C function.
Improve cdata display
If you are working with LuaJIT's cdata and want to improve their display during debug, simply add this line at the top of your application entry point (by default main.lua):
require 'debugger.plugins.ffi'
We implemented a custom inspector for cdata display, it will enable you to browse their structure and values.

