Notice: This Wiki is now read only and edits are no longer possible. Please see: https://gitlab.eclipse.org/eclipsefdn/helpdesk/-/wikis/Wiki-shutdown-plan for the plan.
CDT/User/NewIn86
Contents
- 1 Editor
- 2 Refactoring
- 3 Debug
- 3.1 Display of GDB version
- 3.2 Display of thread names
- 3.3 Per-element number format
- 3.4 Terminating or disconnecting multiple processes with one command
- 3.5 Register grouping
- 3.6 Pinning of Multicore Visualizer view
- 3.7 Edit connection properties in remote launch
- 3.8 Remote debugging support in the Standalone Debugger
- 3.9 Example plug-in extending DSF-GDB
- 3.10 Load Symbols from Modules view (DSF-GDB)
- 4 Miscellaneous
- 5 Bugs fixed in this release
Editor
Save actions
C/C++ Editor now supports save actions similar to JDT. Details TBD.
This feature was contributed by Marco Stornelli through bug 241355.
Refactoring
File rename when renaming a class
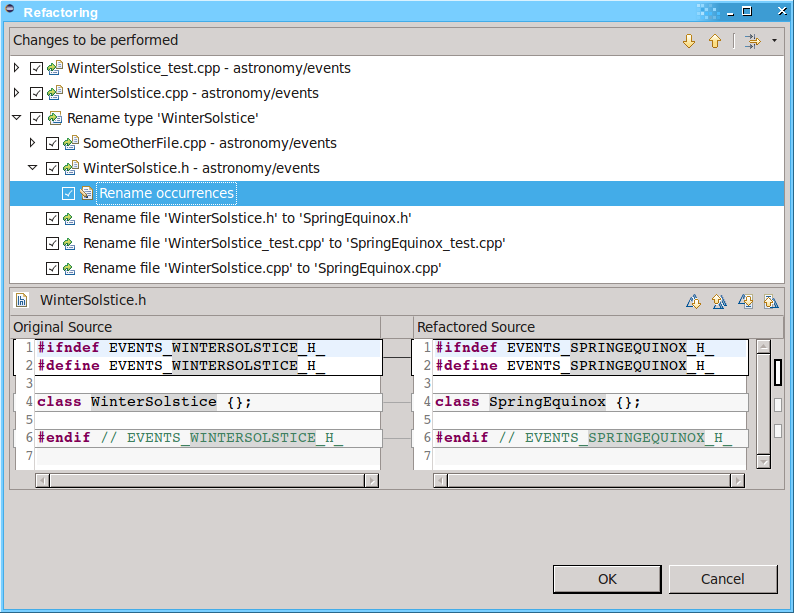
Renaming a class can now rename the files containing the class declaration, implementation and tests. The files are renamed if their names are related to the name of the class being renamed.
This feature was completed through bug 456099.
Debug
Display of GDB version
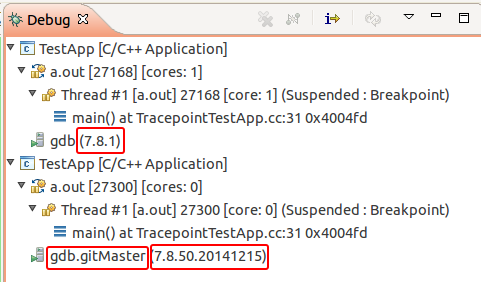
CDT now prints the version of GDB in the Debug view in the label of the node representing the GDB binary. Furthermore, the name of the binary, as filled by the user in the launch tab will be displayed. Previously, only the string "gdb" was shown.
Also, the version of GDB will be printed in the eclipse gdb console along with the rest of GDB's launch message, when starting a new debug session.
This enhancement was completed through bug 455408.
Display of thread names
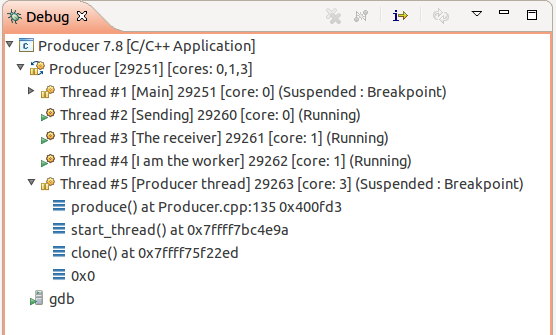
The CDT now shows the name of threads in the Debug view. GDB started reporting that information as of version 7.3. However, this only affects Linux platforms, as there does not seem to be a way to name threads on Windows, while the GDB on Mac does not yet report thread names.
To properly show these thread names, the format of the Thread display has been slightly modified to be as shown below:
This was a contribution by Simon Marchi and was completed through bug 378154.
Per-element number format
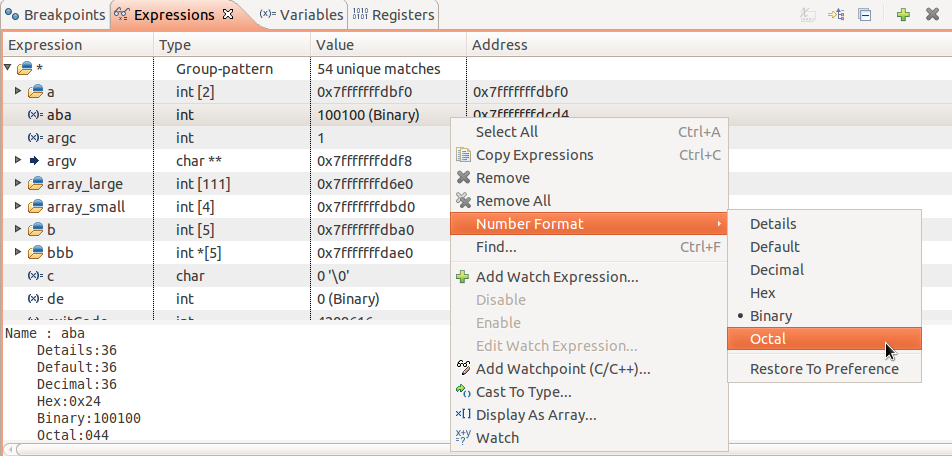
The CDT now supports setting the number format for individual elements of the Variables, Expressions and Registers views. The selected format of each element will be persisted across debug sessions and across Eclipse restarts.
Note that a selected format is per view instance which means that if a view is cloned, the second instance will not follow the formatting of the original view, and can be given a different format for similar elements.
This feature was completed through bug 439624.
Terminating or disconnecting multiple processes with one command
It is possible now to terminate or disconnect multiple processes running in same debug session using a single "Terminate" or "Disconnect" command.
This feature was completed through bug 434558.
Register grouping
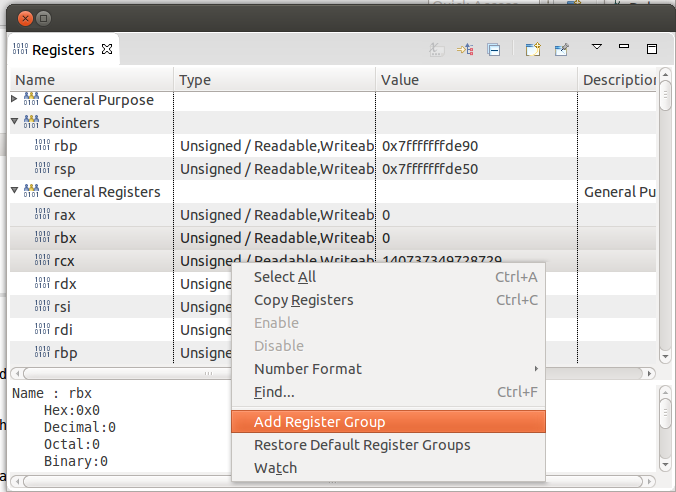
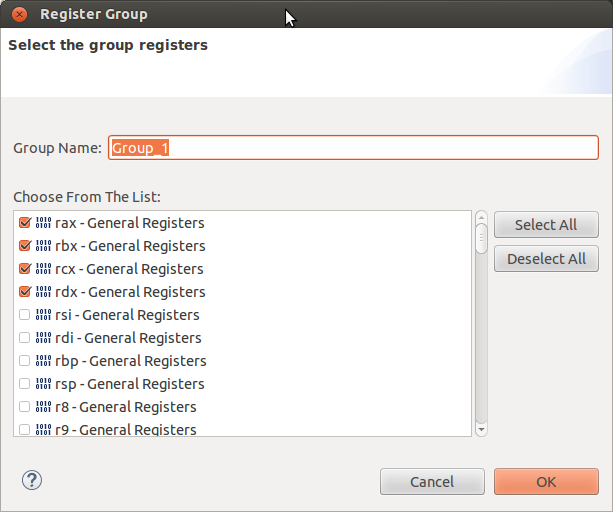
This feature makes it possible for the user to select an arbitrary set of available registers and create a register group which is visualized under the registers view.
The register view can then be used to collapse and expand these groups to display the contents.
These groups can be edited to add/remove selected registers and/or to edit the group's name
These groups are preserved so the user does not have to re-create them when using the same launch configuration.
This feature was completed through bug 235747.
Pinning of Multicore Visualizer view
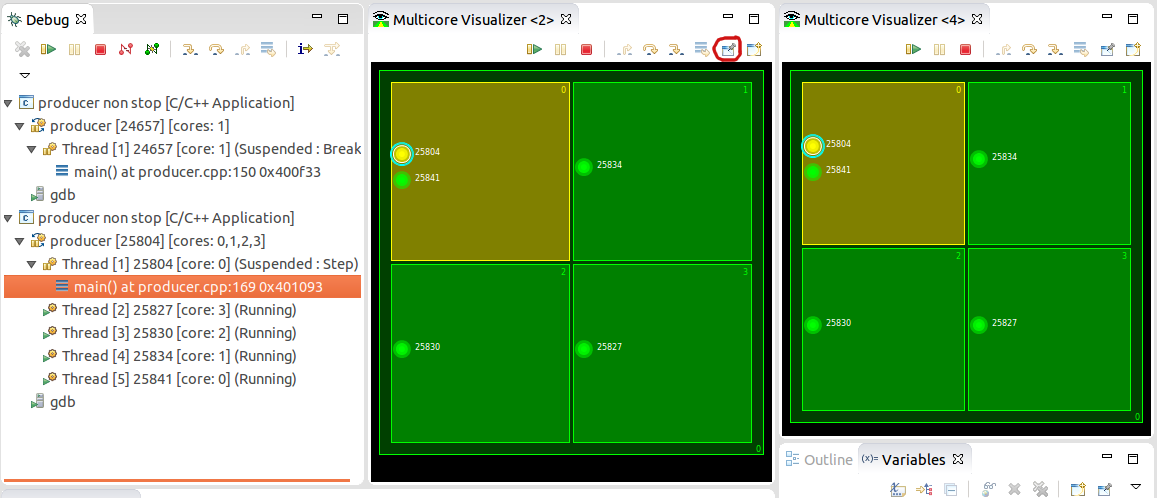
CDT now supports the pinning of Multicore Visualizer views. A "pin view to debug session" toggle button was added to the Multicore Visualizer toolbar, that permits pinning a MV view to the current debug session.
A Multicore Visualizer view, when pinned, will continue showing the debug session it's pinned-on, even when another debug session is selected in the Debug view.
Pinning is most useful when used in conjunction with MV view cloning. It can be used to setup a workspace where a user can visualize what's happening with multiple debug sessions, being run in parallel.
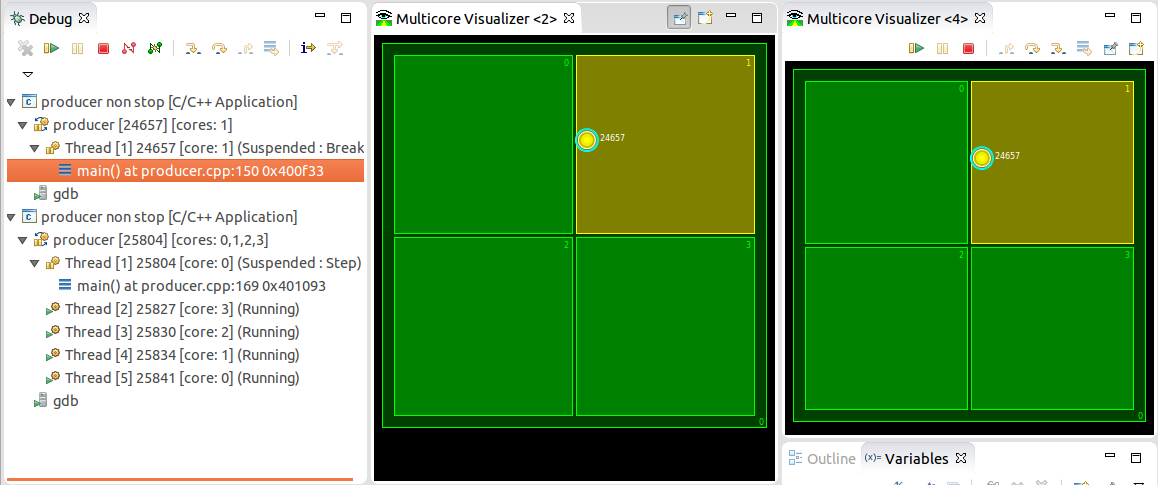
Here's a simple example to demonstrate pinning: we have a workbench with two Multicore Visualizers views. There are two ongoing debug sessions in the Debug view; session #2 is selected, and shown in both MVs. Note that the new "pin" button is highlighted in the first MV:
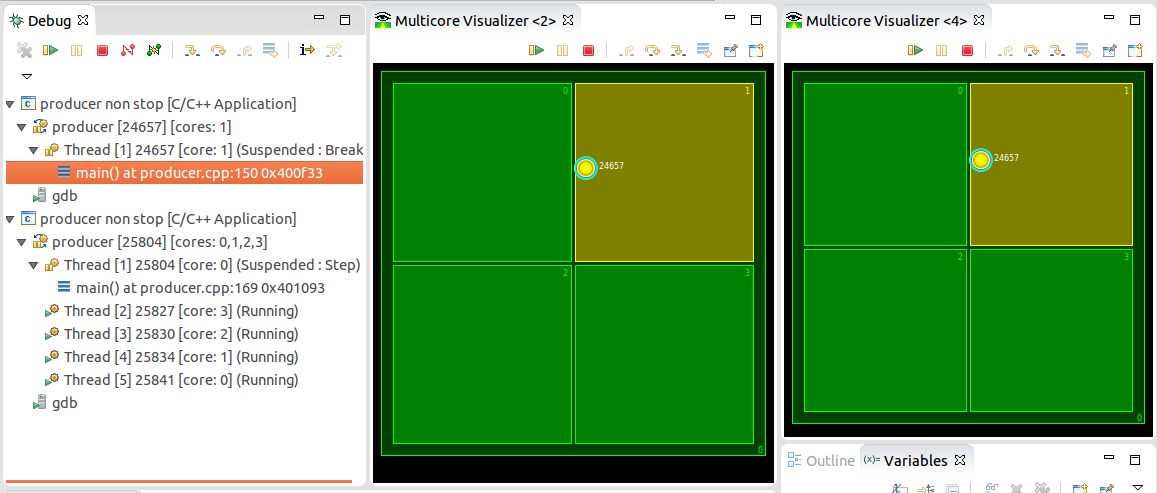
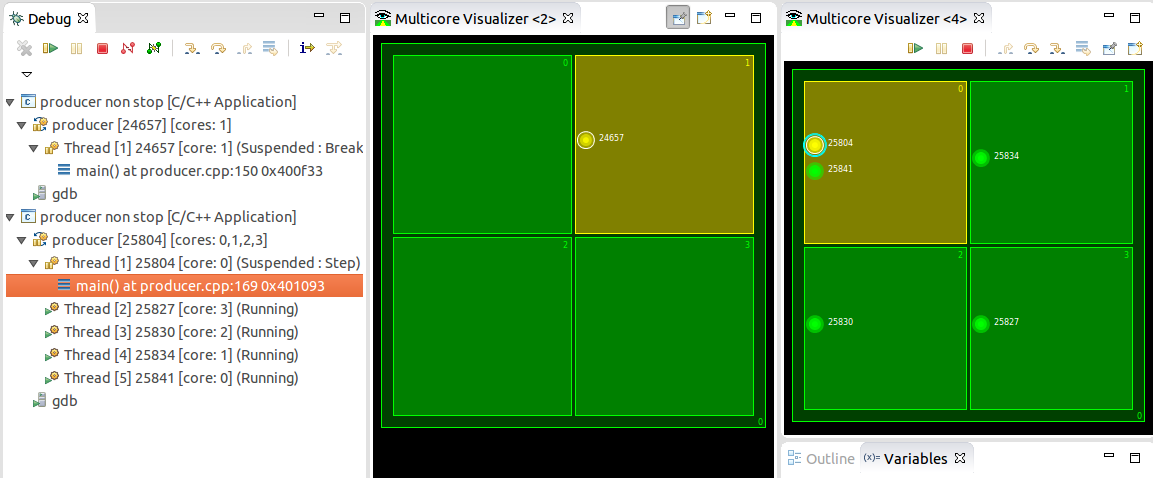
We switch to session #1, and both MVs follow:
We pin the first MV to session #1:
We switch to debug session #2; pinned MV stays on session #1:
This feature was completed through bug 441713.
Edit connection properties in remote launch
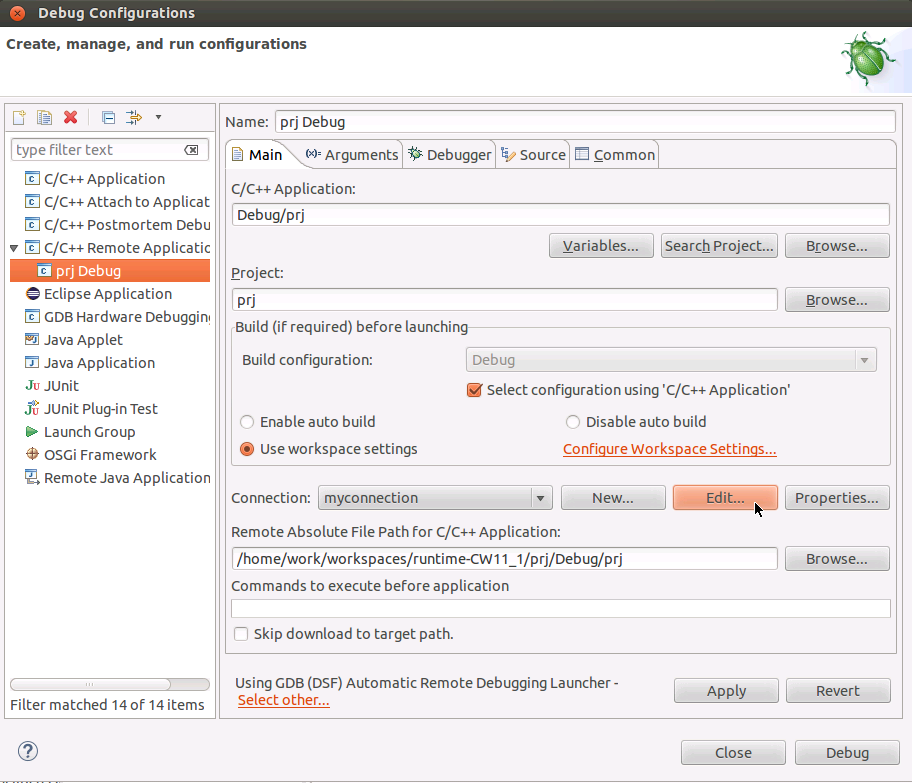
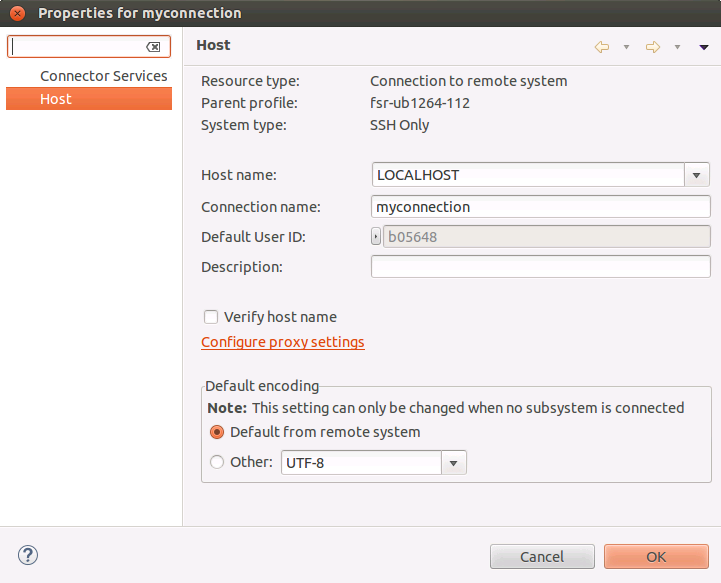
For 'C/C++ Remote Application' launch configurations there is a new 'Edit...' button in the Main tab. Its aim is to give access to the selected connection properties such as host name. So far changing the connection properties was only possible through the Remote Systems view.
This feature was a contribution from Iulia Vasii and was completed through bug 370768.
Remote debugging support in the Standalone Debugger
The CDT Standalone Debugger now supports remote debugging in the same fashion as standard CDT Debug does. However, it only supports connecting to a running gdbserver, i.e., it will not start gdbserver automatically. To specify a remote debugging session from the command line, the -r option has been added. The new -r flag can optionally be used with the -a flag to trigger a Remote-Attach session.
For example, to perform a remote debugging session to a gdbserver that is running the binary a.out on localhost and port 9999:
~/cdtdebugger/cdtdebug.sh -r localhost:9999 -e ~/a.out
And to perform a remote-attach debugging session to a gdbserver running on localhost and port 9999:
~/cdtdebugger/cdtdebug.sh -r localhost:9999 -a
This feature was completed through bug 450080.
Example plug-in extending DSF-GDB
CDT now provides an example plugin that extends DSF-GDB. This plugin show different techniques that can be used by others to build on top of DSF-GDB. It can be found in the standard CDT git repo under dsf-gdb/org.eclipse.cdt.examples.dsf.gdb.
This plugin was created through bug 441277.
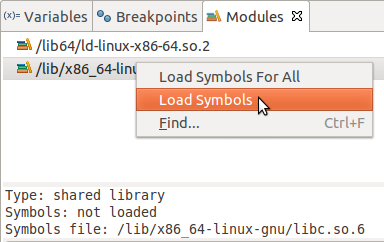
Load Symbols from Modules view (DSF-GDB)
CDI gdb had a feature to load symbols from modules view if they were not already loaded (for example when auto-solib is turned off on startup for performance reasons). DSF gdb up until now did not have this feature implemented, and the menu "Load All Symbols" was always grayed out. Now it should be completely functional. You can select a library or multiple libraries then select Load Symbols - to load only these selected libs or Load All Symbols - to load symbols for all libraries the debugger knows about. Note that you have to select at least one library to activate Load All Symbols (for both dsf or cdi).
This fix/enchancement was created through bug 214398.
Miscellaneous
PowerPC little endian support
CDT can now run on PowerPC Little Endian (ppc64le) architectures. The work was contributed by Wainer dos Santos Moschetta. See bug 443343 for details.
Discontinued support for some older GDB versions
As of CDT 8.6, we will actively support GDB versions 7.1 and higher only.
Older GDB versions are not always working well with newer compilers; it has become difficult and time-consuming to support those versions in newer CDT releases. As of CDT 8.6, we will actively support GDB versions 7.1 and higher. Version 7.1 already dates back to March, 2010. We will not remove the support for older GDBs from the code, but we will make no effort to test or support these older versions.
Plug-in source references
The CDT plug-ins now contain source references. Source references make it easier for projects that depend on CDT to clone the repository and modify the code. For more information on Source References, see PDE/UI/SourceReferences
Bugs fixed in this release
See Bugzilla report Bugs Fixed in CDT 8.6

