Notice: This Wiki is now read only and edits are no longer possible. Please see: https://gitlab.eclipse.org/eclipsefdn/helpdesk/-/wikis/Wiki-shutdown-plan for the plan.
CDT/Obsolete/BreakpointsWorkingGroup
< CDT | Obsolete(Redirected from CDT/BreakpointsWorkingGroup)
Contents
Introduction
Purpose of this group is to improve breakpoint features and usability in CDT.
Next teleconference
Please see minutes of previous meetings below
The next call will be June 14th, 2016 at 11am (Ottawa time)
- North America 1-866-569-4992
- Germany 49-692-2224-6059
- France 33-(0)-17-070-8535
- UK 0800-033-7806
- Switzerland 41-44-580-2115
- Sweden 46-85-063-8386
- Italy 003-902-3604-8268
Attendees use this: Extension: 700 Passcode: 19455
Agenda
- Go over action points
- Demos of different patches currently available
- Feedback on any other tools that were investigated
- Round-table
Design Notes
Breakpoint Properties Dialog
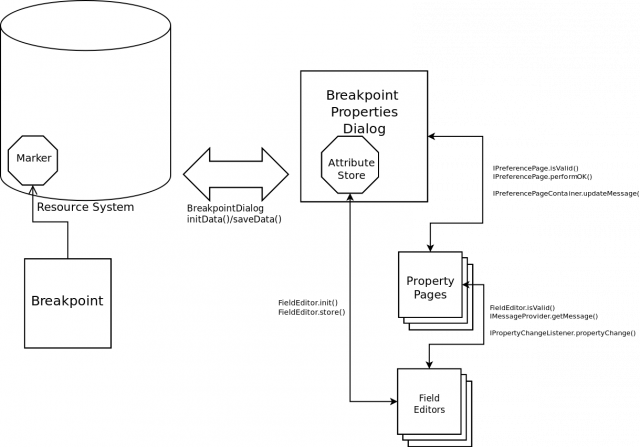
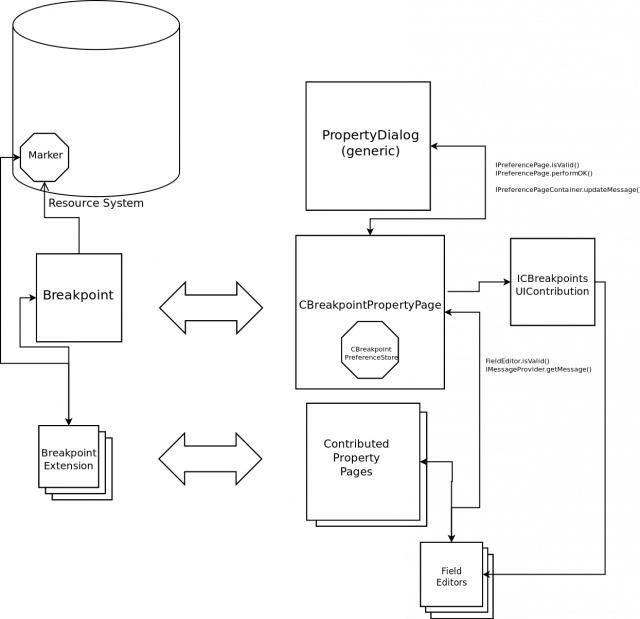
The breakpoint properties dialog design directly affects three of the planned bugs:
- bug 360291 - Allow user to edit line breakpoint file in properties dialog
- bug 360295 - Customize property dialog for editing breakpoints
- bug 360588 - Allow user to edit all its properties prior to creating the breakpoint [DONE]
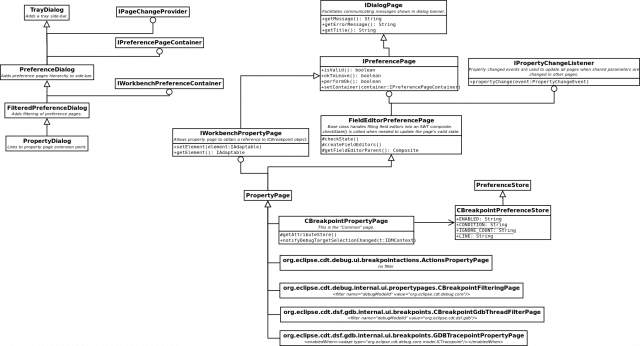
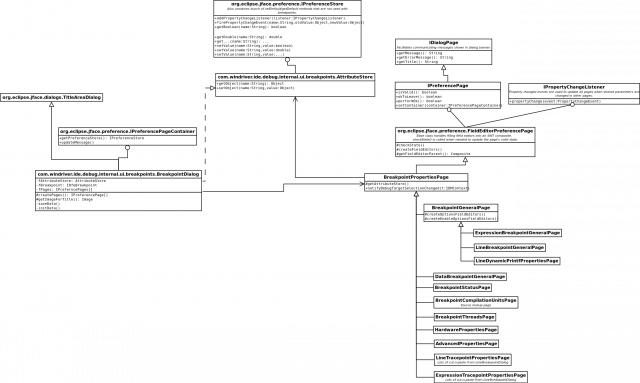
The data flow in the breakpoint properties dialog is illustrated in the following diagram. Below it is a comparison diagram from the Wind River product.
Minutes of meetings
June 14th 2016
Attendees
- Mikhail Khodjaiants (Mentor)
- Jonah Graham (Kichwa Coders)
- Alvaro Sanchez-Leon (Ericsson)
- Marc Dumais (Ericsson)
- Marc-Andre Laperle (Ericsson)
- William Riley (Renesas)
- Stanislav Perepelitsa (NXP)
- Marc Khouzam (Ericsson)
Minutes
- Mikhail demo a preliminary patch to demonstrate we could display target breakpoint nodes under the main platform breakpoint node.
- This made us realize that showing all targets for each breakpoint ends up being pretty much showing the entire debug view tree under each breakpoint
- Showing all targets is not a feasible solution
- One alternative was to use the active contexts of the debug view to only show the corresponding targets under the breakpoints
- More thought and discussion needed
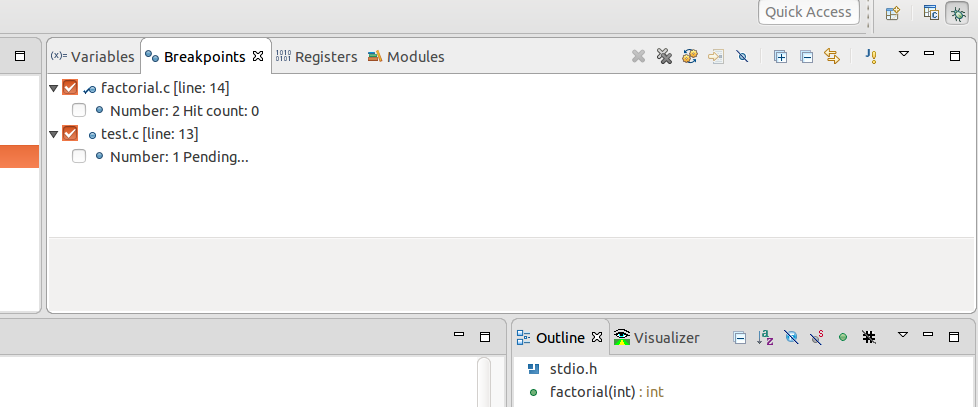
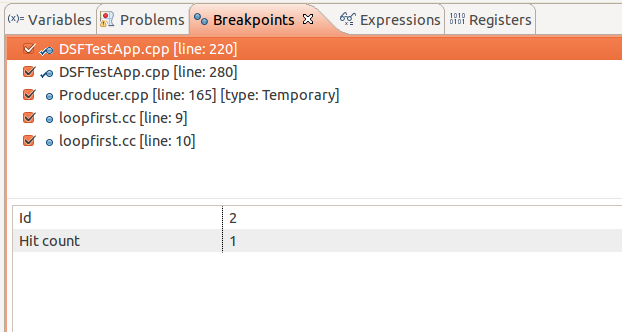
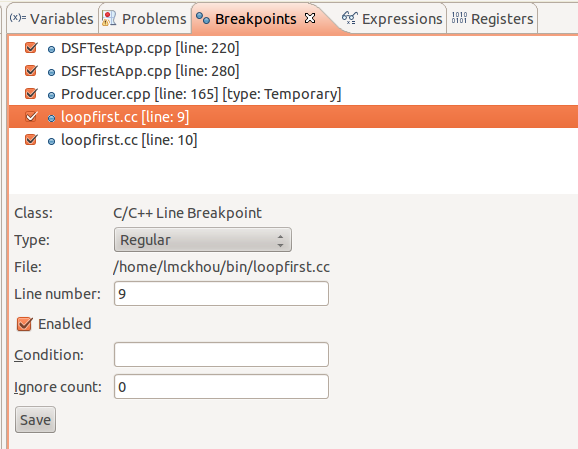
- Marc K demoed two versions of Mikhail's patch of usage of Breakpoint view detail pane
- https://git.eclipse.org/r/17181
- http://eclip.se/419017
- Mikhail's version showed extra information such as "hit count"
- This allowed to give the user access to info that is currently not available
- Alvaro's version allowed to edit some breakpoint properties directly
- This can allow users to notice that they can perform certain actions on breakpoint like changing its type
- Alvaro's version allowed to edit some breakpoint properties directly
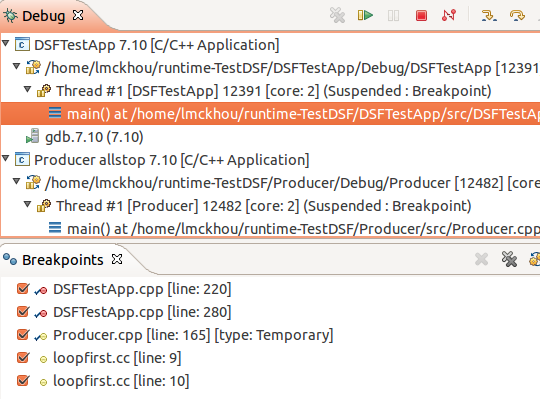
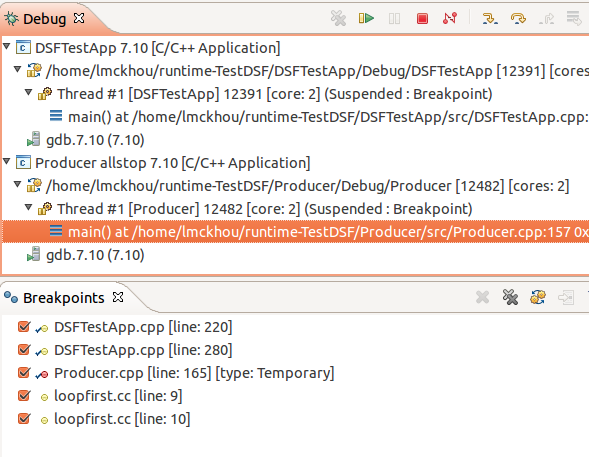
- Jonah demoed Mikhail's patch of using colour for breakpoint installation status
- https://git.eclipse.org/r/25848
- The breakpoint would always show in the breakpoint view and in the editor, but its colour would change based on the active debug context
- Next call in a month to continue discussion
Actions
- Everyone to think about ideas of what should be shown in the main breakpoints view
- Everyone to think about ideas of what should be shown in the detail pane of the breakpoints view
- Look into how other IDEs handle breakpoints to address such issues. List of other possible IDEs is at the bottom of this page.
- Try to find a multicore platform that could be used to better understand use-cases for breakpoints
April 19th, 2016
Attendees
- Mikhail Khodjaiants (Mentor)
- Tracy Miranda (Kichwa Coders)
- Jonah Graham (Kichwa Coders)
- Marc Dumais (Ericsson)
- Marc Khouzam (Ericsson)
Minutes
- Issues
- Hard for users to control where breakpoints are installed on multi-core systems
- Breakpoints don't work smoothly in a multi-session situation
- High-level requirements
- Users have trouble seeing where a breakpoint actually applies (target, thread, core, etc)
- Users need a good way to control where a breakpoint should apply
- Need to persist user-configured applicability of breakpoints
- Need multiple breakpoints at the same location so as to configure each one differently
- Synchronization with the GDB console should work in all cases
- Can we show columns in the breakpoints view?
- Actions
- Mikhail to re-implement a prototype to show target breakpoint nodes under main platform breakpoint node
- Others to provide Mikhail with small list of expectations about what should be shown in the breakpoints view for his prototype
- Marc K or Alvaro to prepare demo of Mikhail's patch of usage of Breakpoint view detail pane
- Jonah to prepare demo of Mikhail's patch of using colour for breakpoint installation status
- Look into how other IDEs handle breakpoints to address such issues:
- DS-5 (ARM)
- Code-XL (AMD)
- Visual Studio (MS)
- DDT Debugger (Allinea)
- TotalView (RogueWave)
- Lauterbach Debugger (Lauterbach)
- CCS Debugger (TI)
- XTensa Debugger (Tensilica)
- C-SPY (IAR)

