Notice: this Wiki will be going read only early in 2024 and edits will no longer be possible. Please see: https://gitlab.eclipse.org/eclipsefdn/helpdesk/-/wikis/Wiki-shutdown-plan for the plan.
Difference between revisions of "COSMOS Design 237655"
(→Visualization meta data) |
(→Visualization meta data) |
||
| Line 95: | Line 95: | ||
==Visualization meta data== | ==Visualization meta data== | ||
| − | The Visualization meta data describes a list of visualizations for a data manager. Consider the following pseudo schema. | + | The Visualization meta data describes a list of visualizations for a data manager. Client applications can look at the meta data to determine the available visualizations. Consider the following pseudo schema. |
<pre> | <pre> | ||
| Line 108: | Line 108: | ||
<input name="xs:string" type="xs:string" xs:anyAttribute/>? | <input name="xs:string" type="xs:string" xs:anyAttribute/>? | ||
xs:any* | xs:any* | ||
| − | </ | + | </inputParameters> |
<outputFormat xs:anyAttribute > | <outputFormat xs:anyAttribute > | ||
<format>xs:InternetMediaType</format> | <format>xs:InternetMediaType</format> | ||
| Line 123: | Line 123: | ||
===Example Visualization Meta Data=== | ===Example Visualization Meta Data=== | ||
| − | The following example shows | + | The following example shows meta data that represents two visualization for a data manager that collects log events. The first entry represents a top 10 report. The second entry represents a report consisting of a table that lists the event. The user can submit a filter or sort criteria for the second report. Note that both visualizations produces HTML outputs as indicated by the outputFormat tag (i.e. text/html). |
<pre> | <pre> | ||
| Line 132: | Line 132: | ||
<description>A report that shows the top 10 sub components with the most logging events</description> | <description>A report that shows the top 10 sub components with the most logging events</description> | ||
</visualizationDescription> | </visualizationDescription> | ||
| − | <inputParameters | + | <inputParameters/> |
| − | + | ||
<outputFormat xs:anyAttribute > | <outputFormat xs:anyAttribute > | ||
<format>text/html</format> | <format>text/html</format> | ||
</outputFormat> | </outputFormat> | ||
| − | < | + | <visualizationId> |
<mdrId>org.eclipse.cosmos.samples.cdmbf.LoggingDM</mdrId> | <mdrId>org.eclipse.cosmos.samples.cdmbf.LoggingDM</mdrId> | ||
<localId>1</localId> | <localId>1</localId> | ||
| Line 150: | Line 149: | ||
<input name="sort" type="String"/> | <input name="sort" type="String"/> | ||
<input name="filterCriteria" type="String" xs:anyAttribute/> | <input name="filterCriteria" type="String" xs:anyAttribute/> | ||
| − | </ | + | </inputParameters> |
<outputFormat xs:anyAttribute > | <outputFormat xs:anyAttribute > | ||
<format>text/html</format> | <format>text/html</format> | ||
| Line 162: | Line 161: | ||
</pre> | </pre> | ||
| − | === | + | === Render Visualization === |
| − | The | + | The second part of the service provides the ability to render the visualization. |
| − | |||
| − | |||
| − | |||
| − | |||
<pre> | <pre> | ||
| − | + | <visualize> | |
| + | <visualization> | ||
| + | <inputParameters> | ||
| + | <input name="xs:string" xs:anyAttribute> | ||
| + | xs:any* | ||
| + | </input>? | ||
| + | </inputParameters> | ||
| + | <visualizaitonId> | ||
| + | <mdrId>xs:anyURI</mdrId> | ||
| + | <localId>xs:anyURI</localId> | ||
| + | </visualizationId> | ||
| + | </visualize> | ||
</pre> | </pre> | ||
| − | |||
| − | |||
| − | |||
| − | |||
| − | |||
== Report Template Repository == | == Report Template Repository == | ||
Revision as of 15:01, 23 June 2008
Back to Data Reporting Design
Contents
Change History
| Name: | Date: | Revised Sections: |
|---|---|---|
| Sheldon Lee-Loy | 06/23/2008 |
|
Workload Estimation
| Process | Sizing | Names of people doing the work |
|---|---|---|
| Design | 0.4 | Sheldon Lee-Loy |
| Code | 1.4 | |
| Test | 0.5 | |
| Documentation | 0.5 | |
| Build and infrastructure | 0.2 | |
| Code review, etc.* | ||
| TOTAL | 3 |
'* - includes other committer work (e.g. check-in, contribution tracking)
Requirement
A visualization service group can be associated with a data manager via Axis2. The service group will provide a management and a generate service. Assuming an agreeable exchange format, the client will be oblivious in terms of how the visualization are managed and generated.
The management visualization service will allow the client to determine available visualizations on a data manager. Once a visualization is selected, the service will indicate if any user input is required for the generation of the visualization.
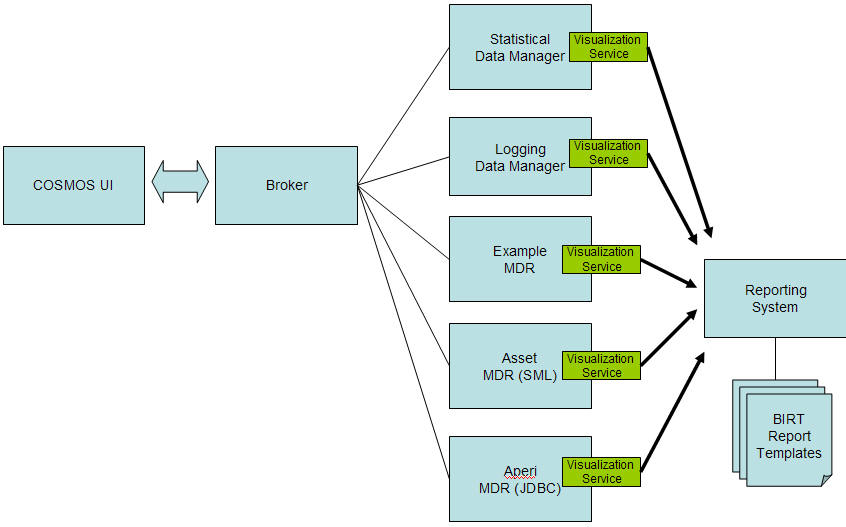
Let us try to understand the value of providing a visualization service on a MDR by considering the current component architecture of COSMOS.
There are several key points that should be understood with the current architecture.
- The COSMOS UI utilizes the broker as a simple lookup service. The COSMOS UI initially gets all the data manager meta information such as a name and a list of services that the data manager provides.
- The COSMOS UI must make sense of the meta information to determine if certain icons should be associated with a particular data manager. Similarly the COSMOS UI must determine whether certain menu options are valid for a certain data manager. Finally, the COSMOS UI must determine if a particular report should be use to render data for a particular data manager. The COSMOS UI makes use of a mapping component that tells the COSMOS UI that a data manager is a statistical data manager, a logging data manager, or a asset data manager.
- If new data managers are present the logic of mapping component would have to change in order for the COSMOS UI to make sense of the data.
- If the meta data information of the data manager changes the mapping component would be broken and would have to be modified based on the meta data information changes.
Design
As seen from the requirement section the COSMOS UI is not very scalable as new data managers are registered or existing data managers are modified.
The main reason for this limitation is due to the fact that the visualization is loosely coupled from the data. This design proposes a tighter integration between the visualization and the data.
Consider the following architecture.
This design introduces a visualization service that is associated with a data manager. This design provides the following benefits.
- Visualizations of the data are readily made available to any client that makes requests to the data manager
- The rendering of the data can work with custom apis since the rendering service can be tightly coupled with the collected data.
- The COSMOS UI does not need mapping logic to associate a visualization to a particular data manager
The visualization service provides two main functions.
- List the available visualization meta data
- Render a specific visualization
Visualization meta data
The Visualization meta data describes a list of visualizations for a data manager. Client applications can look at the meta data to determine the available visualizations. Consider the following pseudo schema.
    <visualizationMetadata>
        <visualization>
            <visualizationDescription>
                <displayName>xs:string</displayName>
                <description>xs:string</description>
                xs:any*
            </visualizationDescription>
            <inputParameters>
               <input name="xs:string" type="xs:string" xs:anyAttribute/>?
                xs:any*
            </inputParameters>
            <outputFormat xs:anyAttribute >
                <format>xs:InternetMediaType</format>
                xs:any*
            </outputFormat>
            <visualizaitonId>
                <mdrId>xs:anyURI</mdrId>
                <localId>xs:anyURI</localId>
            </visualizationId>
        </visualization> *
    </visualizationMetadata>
Example Visualization Meta Data
The following example shows meta data that represents two visualization for a data manager that collects log events. The first entry represents a top 10 report. The second entry represents a report consisting of a table that lists the event. The user can submit a filter or sort criteria for the second report. Note that both visualizations produces HTML outputs as indicated by the outputFormat tag (i.e. text/html).
    <visualizationMetadata>
        <visualization>
            <visualizationDescription>
                <displayName>Top 10 Log Report</displayName>
                <description>A report that shows the top 10 sub components with the most logging events</description>
            </visualizationDescription>
            <inputParameters/>
            <outputFormat xs:anyAttribute >
                <format>text/html</format>
            </outputFormat>
            <visualizationId>
                <mdrId>org.eclipse.cosmos.samples.cdmbf.LoggingDM</mdrId>
                <localId>1</localId>
            </visualizationId>
        </visualization>
        <visualization>
            <visualizationDescription>
                <displayName>Event Log Report</displayName>
                <description>A report that shows logging events in a table.  The end user can sort and filter the table by serverity</description>
            </visualizationDescription>
            <inputParameters>
               <input name="sort" type="String"/>
               <input name="filterCriteria" type="String" xs:anyAttribute/>
            </inputParameters>
            <outputFormat xs:anyAttribute >
                <format>text/html</format>
            </outputFormat>
            <visualizaitonId>
                <mdrId>org.eclipse.cosmos.samples.cdmbf.LoggingDM</mdrId>
                <localId>2</localId>
            </visualizationId>
        </visualization>
    </visualizationMetadata>
Render Visualization
The second part of the service provides the ability to render the visualization.
    <visualize>
        <visualization>
         <inputParameters>
            <input name="xs:string" xs:anyAttribute>
                xs:any*
            </input>?
         </inputParameters>
         <visualizaitonId>
             <mdrId>xs:anyURI</mdrId>
             <localId>xs:anyURI</localId>
         </visualizationId>
    </visualize>
Report Template Repository
The report template repository will consist of a set of report templates and a catalog file. The catalog file will act as a lookup that will associate meta data information with a particular report. Applications can use the catalog file to search for a particular report template. The following is an example of the catalog file:
 <reports>
  <report>
	<metadata>
	<property name="type" value="CBE"/>
	<property name="namespace" value="http://logging/log"/>
        <property name="caption" value="Top 10 Log Report"/>
	</metadata>
        <template id="0" file="templates/LogReport.rptdesign"/>
  </report>
  <report>
	<metadata>
	<property name="type" value="TomcatSet"/>
	<property name="namespace" value="http://statistical/stat"/>
        <property name="caption" value="Statistical Report"/>
	</metadata>
        <template id="1" file="templates/StatReport.rptdesign"/>
  </report>
</reports>
Graph Response Report
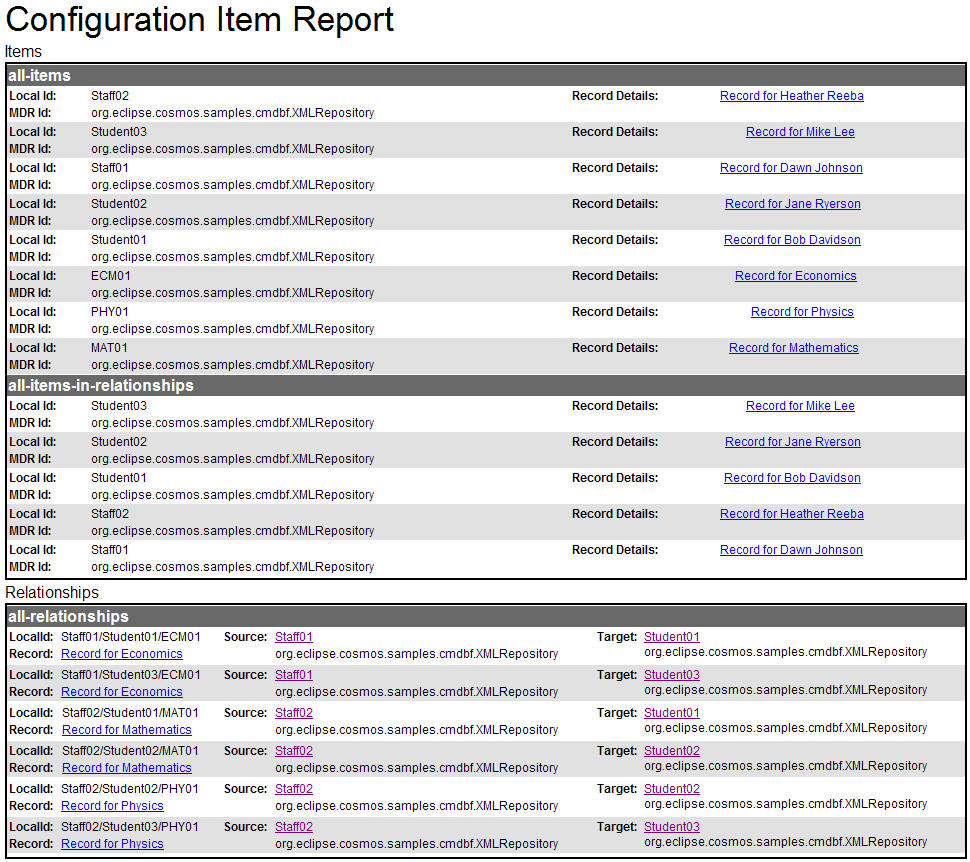
The following shows a mockup of a basic graph response report template.
The above report groups the records by items and relationships. Notice that if a record is present a link is provided. The link will drill down to a report that can render the record schema. The report that is associated with the record namespace will be used to render the record information. Therefore, the report template will make a request to the report servlet describe above to render the appropriate report.
Open Issues/Questions
All reviewer feedback should go in the Talk page for 230405.


