Notice: this Wiki will be going read only early in 2024 and edits will no longer be possible. Please see: https://gitlab.eclipse.org/eclipsefdn/helpdesk/-/wikis/Wiki-shutdown-plan for the plan.
Difference between revisions of "CDT/Obsolete/MultiCoreDebugWorkingGroup/CompletedFeatures"
(→Debugging without the Debug view (Breadcrum)) |
m (Jonah.kichwacoders.com moved page CDT/MultiCoreDebugWorkingGroup/CompletedFeatures to CDT/Obsolete/MultiCoreDebugWorkingGroup/CompletedFeatures) |
||
| (7 intermediate revisions by one other user not shown) | |||
| Line 1: | Line 1: | ||
| − | + | = Multi-core debugging features that have already been implemented = | |
| − | + | == Debugging without the Debug view (Breadcrumb) == | |
As of Eclipse 3.6 (Helios), a debug Breadcrumb has been implemented to dramatically reduce the size of the Debug View. The user can simply manually shrink the Debug View to a single line, and the Breadcrumb will automatically be activated. For details, see user documentation for Debug View and [http://bugs.eclipse.org/252677 Bug 252677]. | As of Eclipse 3.6 (Helios), a debug Breadcrumb has been implemented to dramatically reduce the size of the Debug View. The user can simply manually shrink the Debug View to a single line, and the Breadcrumb will automatically be activated. For details, see user documentation for Debug View and [http://bugs.eclipse.org/252677 Bug 252677]. | ||
| − | + | == Showing cores in Debug view labels == | |
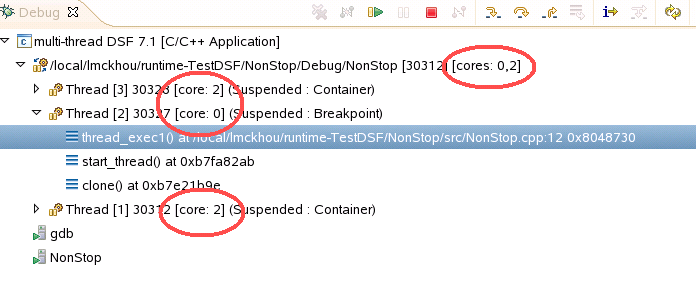
By using the enhancements of GDB 7.1, we can show the core on which each thread runs as an extra part of the Debug View label. We can do the same for processes. The below image shows this. | By using the enhancements of GDB 7.1, we can show the core on which each thread runs as an extra part of the Debug View label. We can do the same for processes. The below image shows this. | ||
| Line 12: | Line 12: | ||
This feature has been implemented for CDT 8.0 as part of [https://bugs.eclipse.org/bugs/show_bug.cgi?id=318230 Bug 318230] | This feature has been implemented for CDT 8.0 as part of [https://bugs.eclipse.org/bugs/show_bug.cgi?id=318230 Bug 318230] | ||
| + | |||
| + | == Multi-process debugging == | ||
| + | |||
| + | CDT now supports debugging multiple processes in a single debug session. It allows to attach/detach and start/stop processes repeatedly and easily. | ||
| + | |||
| + | Requirements: | ||
| + | |||
| + | *GDB 7.2 or greater | ||
| + | *Currently, only Non-Stop debugging sessions support multiple processes. | ||
| + | *Note that this feature was developed and tested on Linux systems, and may not work on Windows. | ||
| + | |||
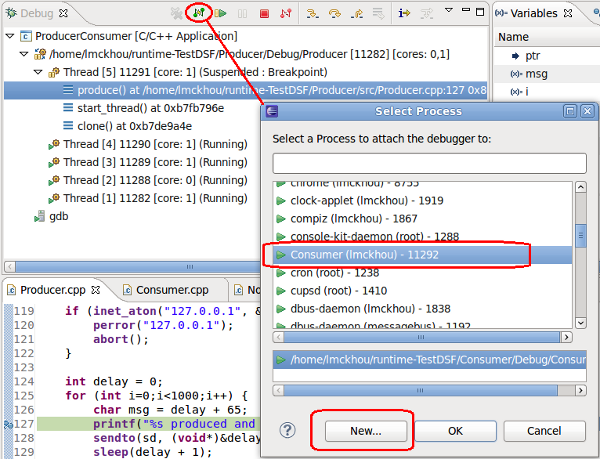
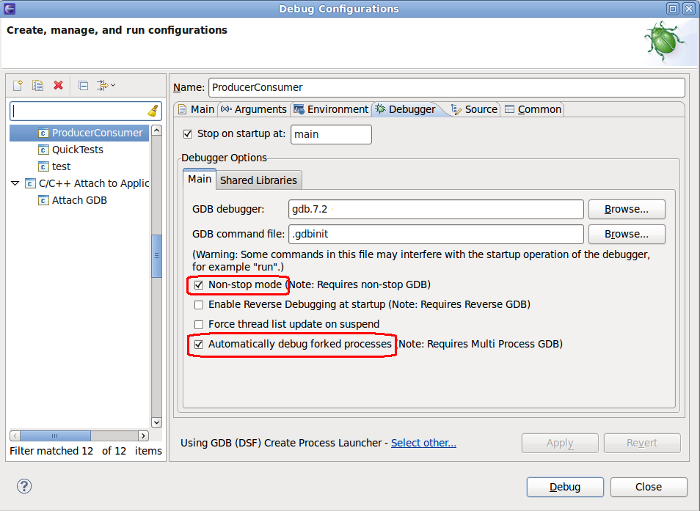
| + | To use multi-process debugging, simply launch an application as you normally would, locally or remotely, using gdbserver, and make sure to select Non-stop mode in the Debugger tab. Then, use the Debug View's "Connect" button to trigger a dialog with allows you to either attach to a running process, or to create a new process using the "New..." button. Currently, the "New..." button is only supported for Local debug sessions. | ||
| + | |||
| + | [[Image:MultiAttachDialog.png]] | ||
| + | |||
| + | <br> | ||
| + | |||
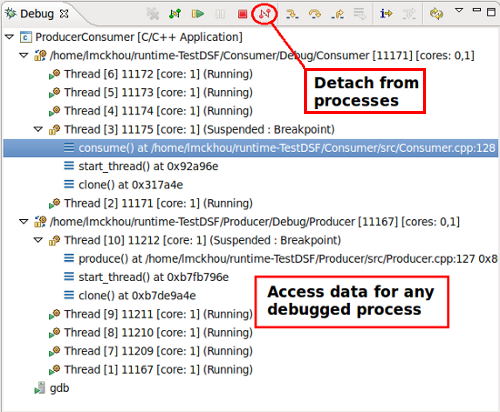
| + | You will then have the newly selected process added to your debug session, where you can control it and examine it. You can use the "Disconnect" button to remove processes from your debug session, or you can use the "Connect" button to add new ones. | ||
| + | |||
| + | [[Image:MultiProducerConsumer.png]] | ||
| + | |||
| + | <br> | ||
| + | |||
| + | An option to automatically attach to a forked process is also available. This means that whenever any process you are currently debugging forks a new process, that new process will be added to your debug session. | ||
| + | |||
| + | <br> [[Image:AutoAttachOption.png]] | ||
| + | |||
| + | == Pin & Clone == | ||
| + | |||
| + | The Variables, Expressions, Registers, Disassembly, and Memory Browser now supports opening multiple instances of the views, as well as pinning the view input to the selected debug context(s) of the Debug view. | ||
| + | |||
| + | [[Image:Pin&Clone.png]] | ||
| + | |||
| + | This feature has been implemented for CDT 8.0 as of Feb 15th, 2011, as part of [http://bugs.eclipse.org/327263 Bug 327263], [http://bugs.eclipse.org/331781 Bug 331781], and [http://bugs.eclipse.org/334566 Bug 334566]. | ||
| + | |||
| + | The original design page can be found [[PinAndClone | here.]] | ||
| + | |||
| + | == Multicore Visualizer == | ||
| + | |||
| + | [http://wiki.eclipse.org/CDT/User/NewIn81#Multicore_Visualizer_View Please see this description] | ||
| + | |||
| + | == Edit Breakpoint on Create == | ||
| + | |||
| + | [http://wiki.eclipse.org/CDT/User/NewIn81#Edit_Breakpoint_on_Create Please see this description] | ||
| + | |||
| + | == OSResources view == | ||
| + | |||
| + | [http://wiki.eclipse.org/CDT/User/NewIn82#OS_Resources_View Please see this description] | ||
Latest revision as of 16:06, 16 January 2020
Contents
Multi-core debugging features that have already been implemented
Debugging without the Debug view (Breadcrumb)
As of Eclipse 3.6 (Helios), a debug Breadcrumb has been implemented to dramatically reduce the size of the Debug View. The user can simply manually shrink the Debug View to a single line, and the Breadcrumb will automatically be activated. For details, see user documentation for Debug View and Bug 252677.
Showing cores in Debug view labels
By using the enhancements of GDB 7.1, we can show the core on which each thread runs as an extra part of the Debug View label. We can do the same for processes. The below image shows this.
This feature has been implemented for CDT 8.0 as part of Bug 318230
Multi-process debugging
CDT now supports debugging multiple processes in a single debug session. It allows to attach/detach and start/stop processes repeatedly and easily.
Requirements:
- GDB 7.2 or greater
- Currently, only Non-Stop debugging sessions support multiple processes.
- Note that this feature was developed and tested on Linux systems, and may not work on Windows.
To use multi-process debugging, simply launch an application as you normally would, locally or remotely, using gdbserver, and make sure to select Non-stop mode in the Debugger tab. Then, use the Debug View's "Connect" button to trigger a dialog with allows you to either attach to a running process, or to create a new process using the "New..." button. Currently, the "New..." button is only supported for Local debug sessions.
You will then have the newly selected process added to your debug session, where you can control it and examine it. You can use the "Disconnect" button to remove processes from your debug session, or you can use the "Connect" button to add new ones.
An option to automatically attach to a forked process is also available. This means that whenever any process you are currently debugging forks a new process, that new process will be added to your debug session.
Pin & Clone
The Variables, Expressions, Registers, Disassembly, and Memory Browser now supports opening multiple instances of the views, as well as pinning the view input to the selected debug context(s) of the Debug view.
This feature has been implemented for CDT 8.0 as of Feb 15th, 2011, as part of Bug 327263, Bug 331781, and Bug 334566.
The original design page can be found here.


