Notice: This Wiki is now read only and edits are no longer possible. Please see: https://gitlab.eclipse.org/eclipsefdn/helpdesk/-/wikis/Wiki-shutdown-plan for the plan.
CDT/User/NewIn81
Contents
- 1 Editor
- 2 Refactoring
- 3 Indexing
- 4 Code Analysis
- 5 Build
- 6 Debug
- 6.1 Multicore Visualizer View
- 6.2 Partitioning of large arrays
- 6.3 Edit Breakpoint on Create
- 6.4 Breakpoint Toggle Short-Cuts
- 6.5 Function Breakpoint Manual Entry
- 6.6 Advanced character encoding support
- 6.7 Timeout support for GDB commands in DSF/GDB
- 6.8 Multi-select Resume/Suspend operations
- 6.9 Show only suspended threads in Debug view
- 6.10 Multi-select attach dialog
- 6.11 Default Postmortem file location
- 6.12 Support for Fast Tracepoints
- 6.13 Enhancements to Tracepoints
- 6.14 Show the actual variable type based on RTTI
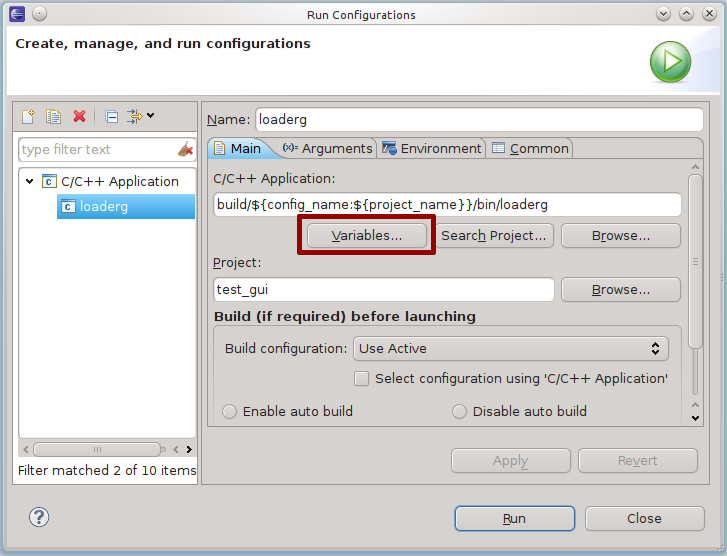
- 6.15 Build variables support in "C/C++ Application" field of launch configuration
- 6.16 Support for octal number format in CDI
- 7 C/C++ Unit Testing Support
- 8 Bugs Fixed in this Release
Editor
Pin the Call Hierarchy View
The Call Hierarchy View can now be pinned which enables the user to open multiple Call Hierarchy views at the same time.
This feature was completed through Bug 342498
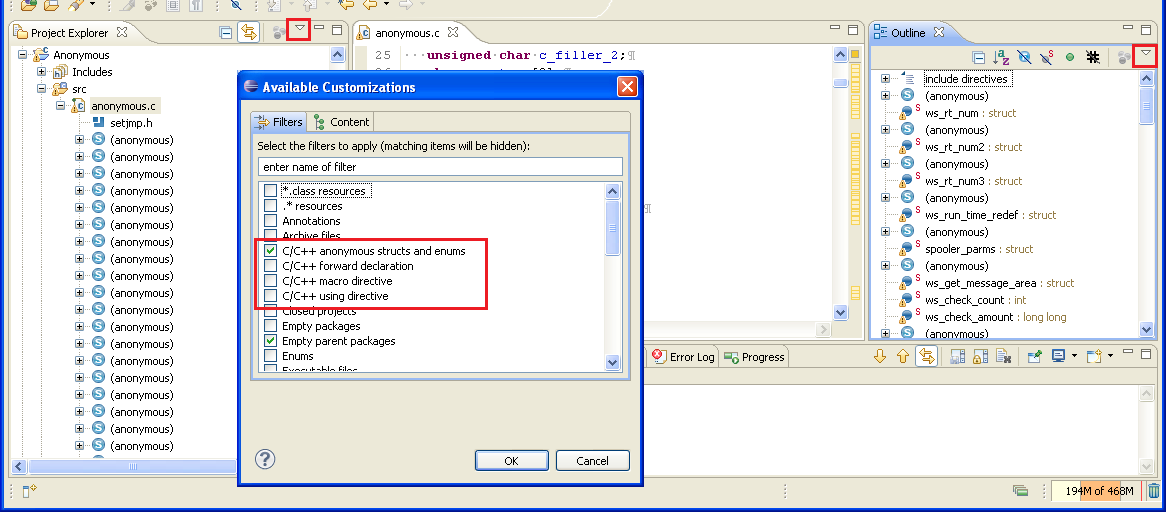
Filtering in Outline Views
There are a few additional filtering options added to Project Explorer and Outline View:
Mouse Hover for 'auto' Keyword
Mouse hover for auto keyword shows deduced type:
Refactoring
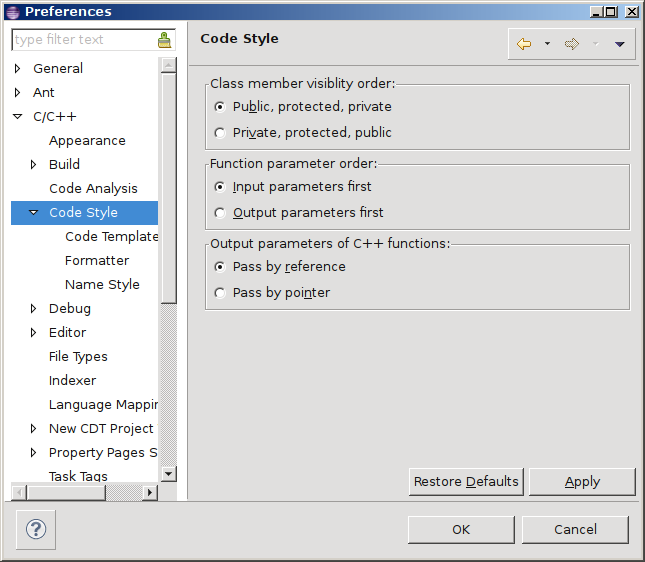
- Code added or changed during refactoring is formatted according to user preferences.
- New code style preferences for refactoring:
Indexing
- Support for multiple variants of the same header file in the index (Bug 197989).
- The C/C++ > Indexer > Index unused headers global preference is turned on by default (Bug 377992).
- New command: Index > Re-resolve Unresolved Includes
Code Analysis
External-tool-based Checkers
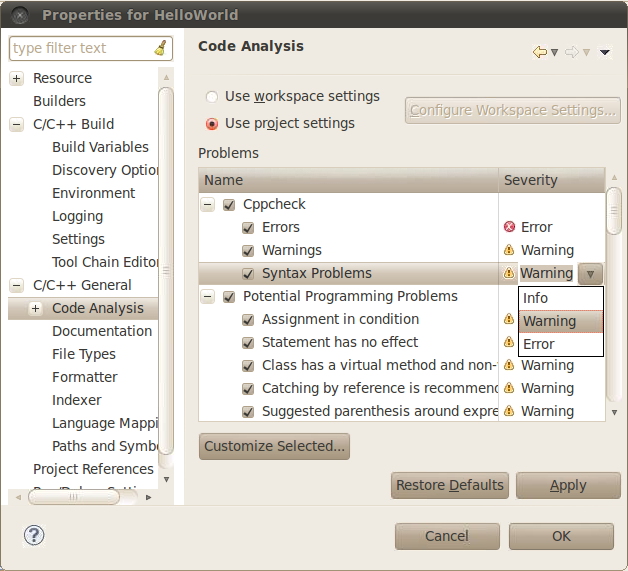
The main motivation for integrating Codan with external tools is to enjoy all the code checks from mature tools without leaving Eclipse. With the new infrastructure:
- External tools can be configured using Codan’s preference page
- External tools are invoked automatically when a C/C++ file is saved
- The output of these tools can be displayed as editor markers
The new infrastructure includes a sample checker that invokes Cppcheck.
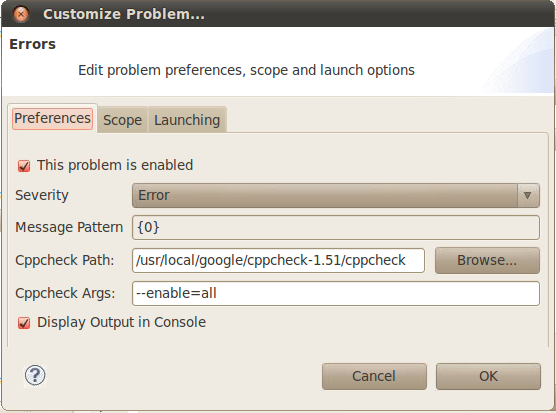
A more detailed configuration dialog can be found by pressing the “Customize Selected…” button:
Users can specify the path of the Cppcheck executable and the arguments to pass to Cppcheck.
A demo of this checker can be found here.
The new infrastructure makes it very easy to write your own external-tool-based checker. In the simplest case, you will need to:
- Extend the abstract class AbstractExternalToolBasedChecker.
- Provide the name of your tool (e.g. "Cppcheck".)
- Provide default values for the path of the executable and arguments to pass to the executable.
- Register a IErrorParser in the extension point "org.eclipse.cdt.core.ErrorParser" with context "codan". This parser parses the output of the external tool, line by line. It’s up to you to decide what to do with the output (e.g. create error markers.)
Please take a look at the source code of CppcheckChecker for details.
In the case of tools that are complex to set up, the new infrastructure is extremely flexible and configurable. It allows you to pretty much to configure every single aspect of the checker, from the files that the tool can check to the way to feed arguments to the tool.
New Codan checkers
- Class members should be properly initialized (Bug 339795). Example:
   struct Demo {
       Demo() {}   // Warning: Member 'field' was not initialized in this constructor

       int field;
   };
Build
Scanner Discovery
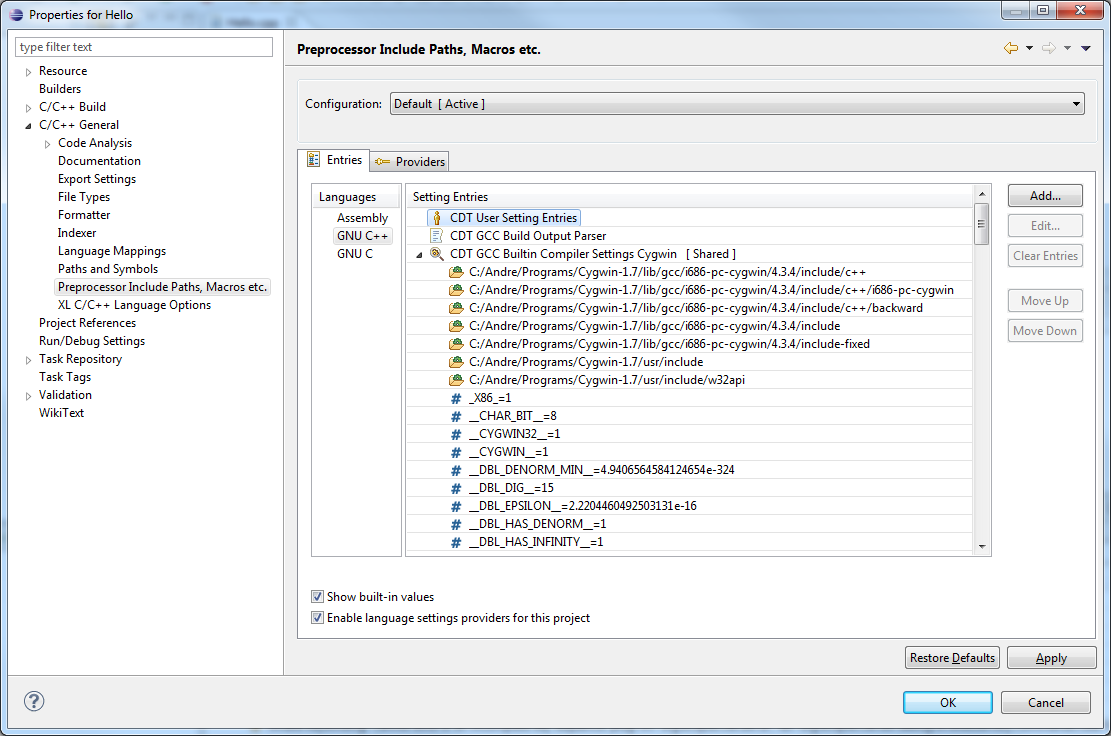
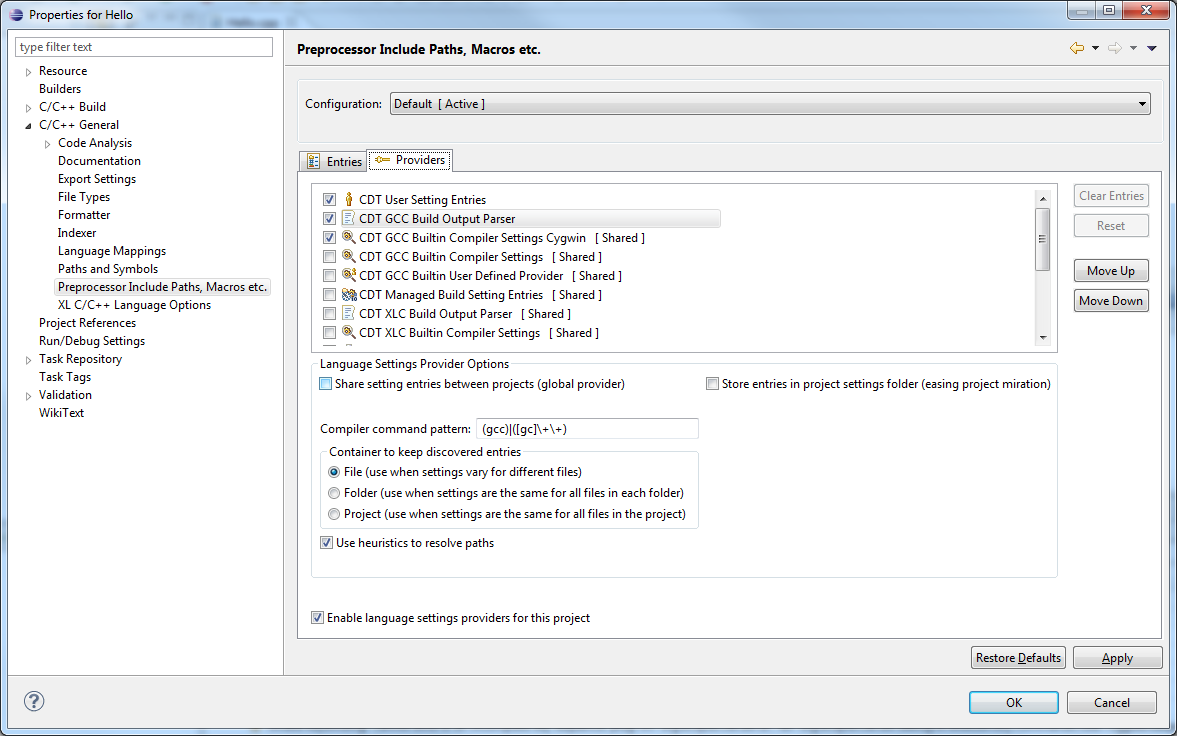
Scanner Discovery has been reworked in this release. The main purpose of Scanner Discovery was always to supply Include Paths and Macros for indexer and build. Now these are supplied by Language Settings Providers. See more at Scanner Discovery Wiki
Mac OSX Frameworks
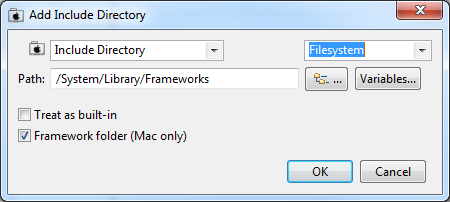
The new scanner discovery makes it possible to discover and use with indexer Mac OSX Frameworks folders, see bug 69529
Console
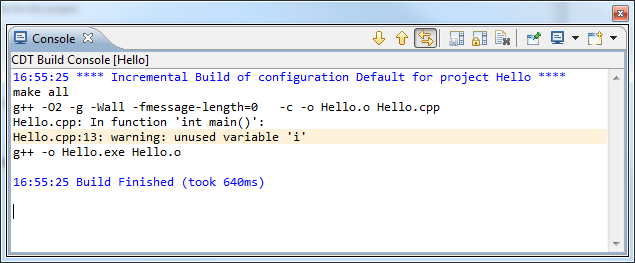
Build console marks more prominently start and end of build and reports elapsed time:
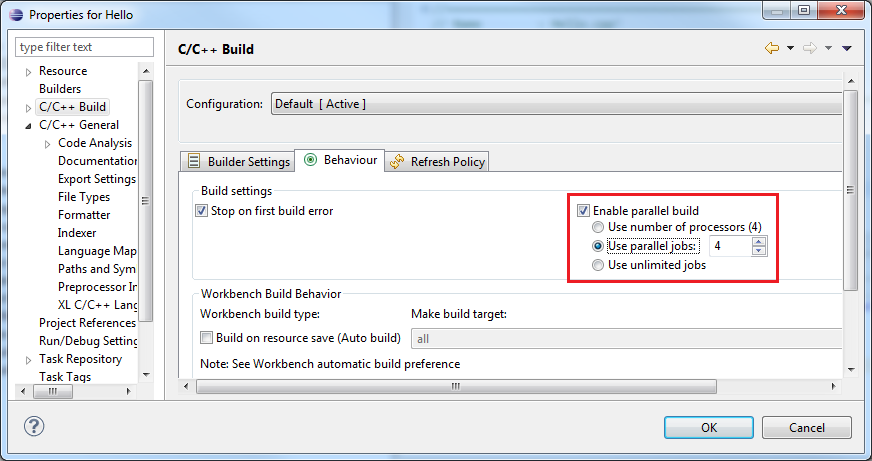
Parallel Build
Parallel Build was remodelled, see bug 259768:
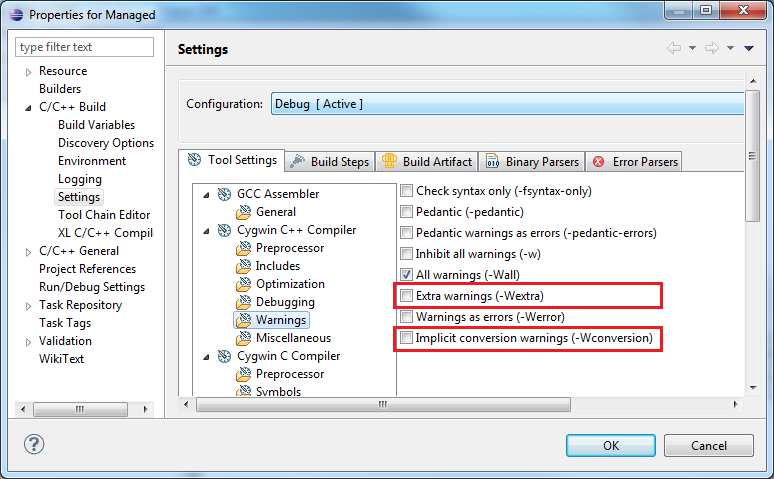
Managed Build
A few additional options to select from added to managed build, bug 365461.
Debug
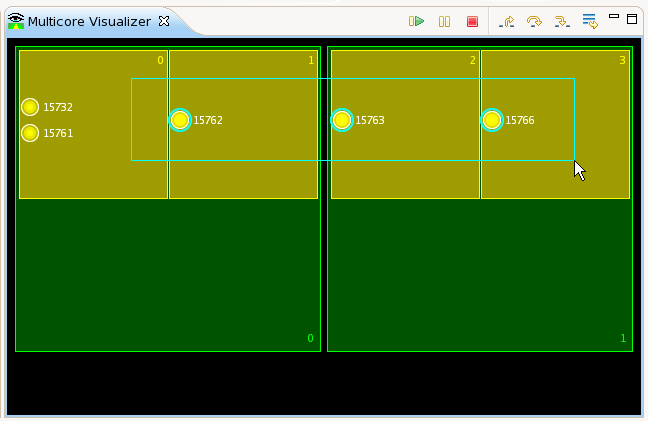
Multicore Visualizer View
CDT now optionally includes a Multicore Visualizer View. This view displays a graphical representation of the state of the current application. It allows one to click- and drag-select groups of processes/threads, and apply debugging commands to them directly from the visualizer. Selections made in the Visualizer View are reflected automatically in the Debug View, and vice versa. The Multicore Visualizer View is designed to scale to large numbers of cpus and cores-per-cpu on both current and future multicore hardware.
The Multicore Visualizer View is meant to serve as a high-level visual overview of the current application, and can be used in tandem with the Debug View, which provides more in-depth detail.
The Multicore Visualizer View is just one example of a visualizer based on the underlying Visualizer Framework plugin. This provides a pluggable, extensible platform for developing visual development tools of this kind.
Note that the Multicore Visualizer will only work using a Linux target; it will not work debugging on a Windows or Mac target. This is a current limitation of GDB which does not provide information about cores, for those targets (at writing, GDB is at version 7.4).
This feature was completed through Bug 335027
The Multicore Visualizer is an optional feature of the CDT and must be installed manually. The feature is called "C/C++ Multicore Visualizer". Installing it will install both the Multicore Visualizer and the Visualizer Framework. If you only want to install the Visualizer Framework (to build your own visualizer), you can install that feature by itself; it is called "CDT Visualizer Framework". Once the features are installed, you can access the Multicore Visualizer (or any other visualizer) by opening the view called "Visualizer".
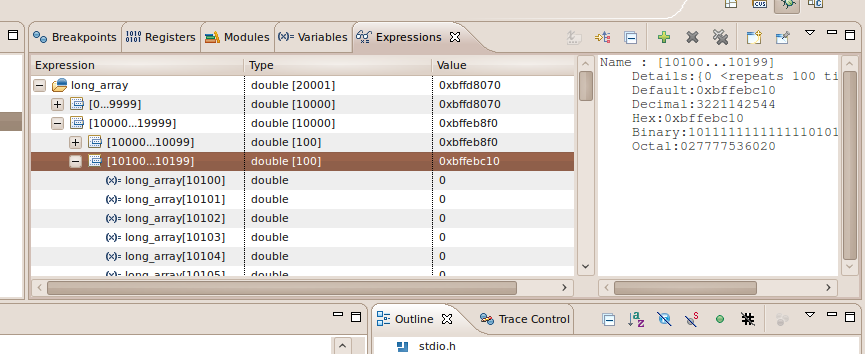
Partitioning of large arrays
CDT now displays large arrays as collections of partitions.
This feature was completed through Bug 365541
Edit Breakpoint on Create
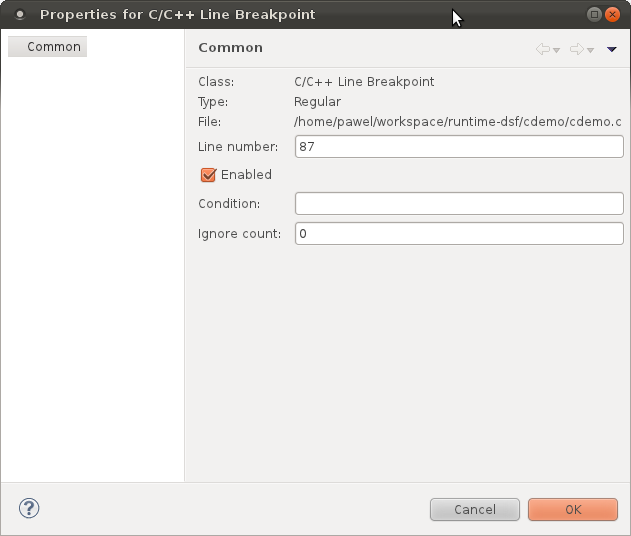
It is no longer necessary to first create a CDT breakpoint, then edit its properties. Properties such as enabled, ignore count, condition, temporary, can be set while creating the breakpoint.
There are several methods to open the properties dialog before creating the breakpoint:
- Add Breakpoint action.
- In the editor or the disassembly view, bring up the popup menu on the gutter.
- Select the Add Breakpoint... menu item.
- This brings up the breakpoint properties dialog for a line breakpoint pre-filled with the breakpoints location.
- Control-Double Click
- Hold the Control key while double-clicking on the editor gutter.
- This brings up the breakpoint properties dialog for a line breakpoint pre-filled with the breakpoints location.
- Control key with Toggle Method Breakpoint
- Open the editor's Outline view.
- Right-click on a method to bring up the popup menu.
- Hold the control key while selecting the Toggle Method Breakpoint action.
- This brings up the function breakpoint dialog pre-filled with the method name.
- Add Watchpoint (C/C++)
- In the Breakpoints view, open the view menu.
- Select the Add Watchpoint (C/C++)... action.
- This brings up the watchpoint properties dialog.
- User must enter the watchpoint expression.
- Add Function Breakpoint (C/C++)
- In the Breakpoints view, open the view menu.
- Select the Add Function Breakpoint (C/C++)... action.
- This brings up the function breakpoint properties dialog.
- User must enter the function expression.
Image: The breakpoint properties dialog for a line breakpoint about to be created.
Breakpoint Toggle Short-Cuts
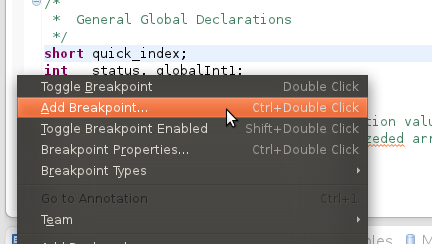
The Toggle Breakpoint action in the editor and disassembly view menu now supports new behaviors when used with modifier keys:
- Hold the Shift key while double-clicking on an existing breakpoint in order to enable or disable the breakpoint.
- Hold the Control key while double-clicking on an existing breakpoint in order to bring up the breakpoint properties dialog to edit the existing breakpoint.
- Hold the Control key while double-clicking on a location with no breakpoints, in order to bring up the breakpoint properties dialog to create a new breakpoint.
Image:The editor gutter popup menu with the hints for the new accelerators.
Function Breakpoint Manual Entry
There is a new option for creating a function breakpoint:
- Open the Breakpoints view menu.
- Select Add Function Breakpoint C/C++.
- Fill in the function name or expression and select OK to create breakpoint.
Advanced character encoding support
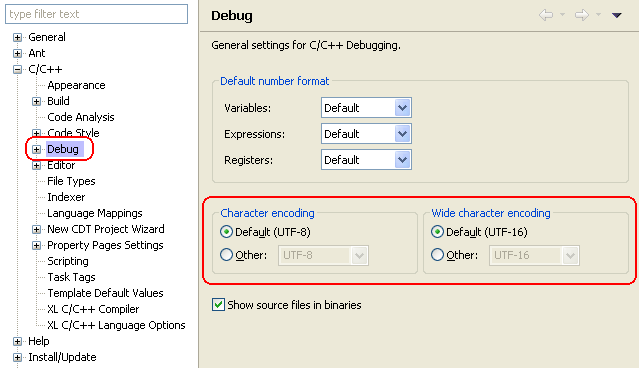
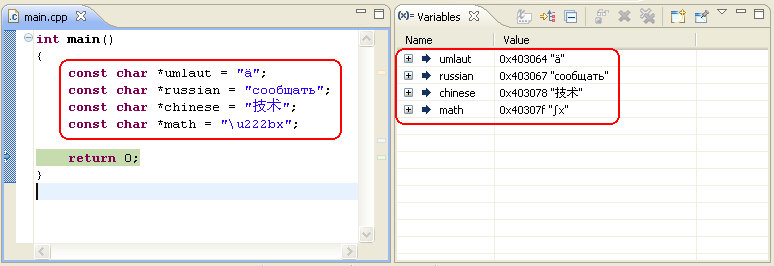
CDT now supports the handling of different character encodings for strings and wide character strings while debugging. This includes full support for Unicode encodings and many other popular encodings as well. You can select the character and wide character encoding within the Debug preferences.
CDT will then correctly display strings according to the selected encoding while debugging.
Note that this feature requires GDB version 7.0 or later. This feature was completed through Bug 307311, Bug 367456 and Bug 370462.
Timeout support for GDB commands in DSF/GDB
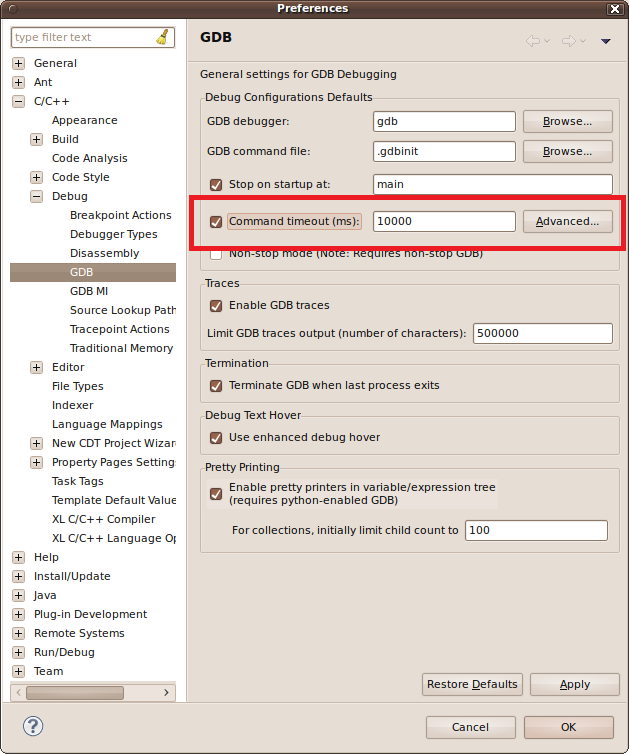
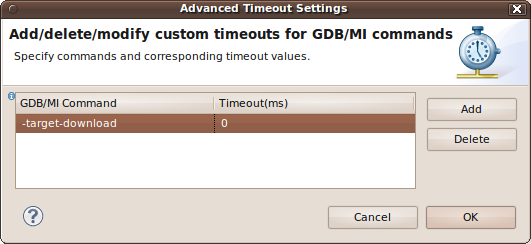
Timeouts for GDB commands are now supported in DSF/GDB. The feature is optional and disabled by default. The timeout values are configurable. When the feature is enabled, custom values can be assigned to some commands, all other commands use the default value. This feature was completed through Bug 361934.
Multi-select Resume/Suspend operations
CDT now allows to perform a Resume or Suspend operation on multiple selections of the same debug session. Because such a concept only adds value in a Non-Stop debug session, it is only supported in such a session (see Non-Stop Debugging). The behavior of a multi-selection Resume/Suspend is as follows:
- Any selected stack frames implies a selection of their corresponding thread.
- If one or more threads are selected (not processes) and the resume/suspend operation is triggered, each selected thread on which the operation is currently valid will be resumed/suspended.
- If one or more processes are selected (not threads) and the resume/suspend operation is triggered, each selected process will be resumed/suspended. Resuming/suspending a process implies resuming/suspending each one of its threads on which the operation is currently valid.
- If both thread(s) and process(es) are selected, and the resume/suspend operation is triggered, each selected process will be resumed/suspended, and each selected thread which is not part of any selected process will be resumed/suspended. The idea is that if a process is being resumed/suspended, each of its threads will be automatically resumed/suspended, and therefore, should not be resumed/suspended a second time because it is also selected.
As hinted above, CDT takes a permissive approach to multi-select resume/suspend. This means that if a multi-selection includes both stopped and running threads, a resume operation is still allowed, and only the suspended threads will be resumed; similarly, on such a multi-selection, a suspend operation is allowed, and only the running threads will be suspended.
Example
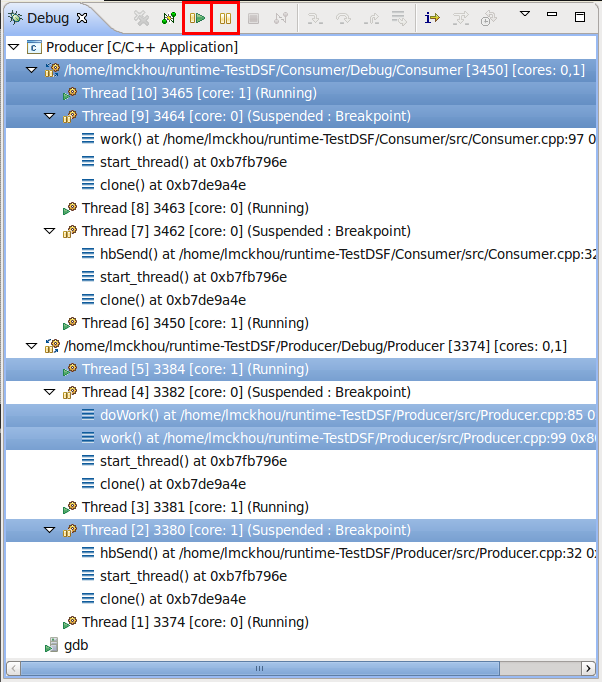
In the above screenshot if the user were to press the Resume button with the current multi-selection the following would happen:
- The Consumer process node is selected, therefore the entire process will be resumed. This means that the suspended threads 7 and 9 will be resumed, while threads 6, 8 and 10 will be ignored, as they are already running.
- Note that the fact that threads 9 and 10 are selected is ignored, as those threads are part of the selected Consumer process, which will be resumed.
- Stack frames doWork() and work() are selected and belong to thread 4, which becomes implicitly selected in their place. Thread 4 will therefore be resumed.
- Thread 2 is selected and suspended, and will be resumed.
- Thread 5 is selected but running, so it will be ignored.
This feature was completed through Bug 330974
Show only suspended threads in Debug view
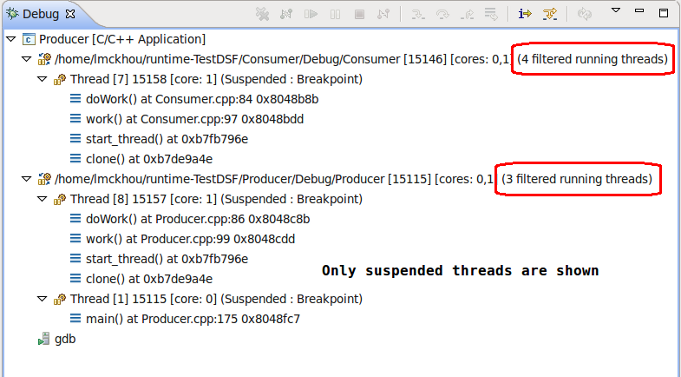
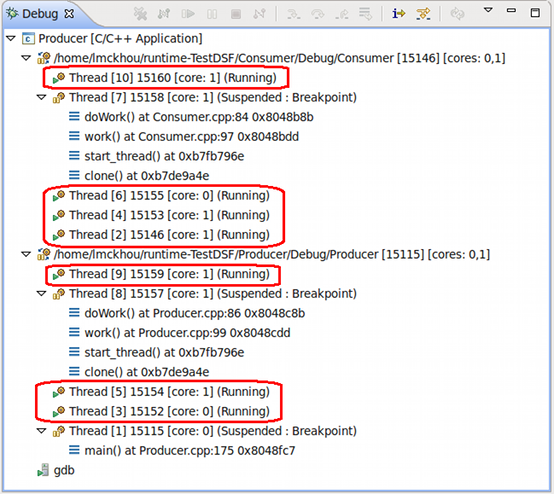
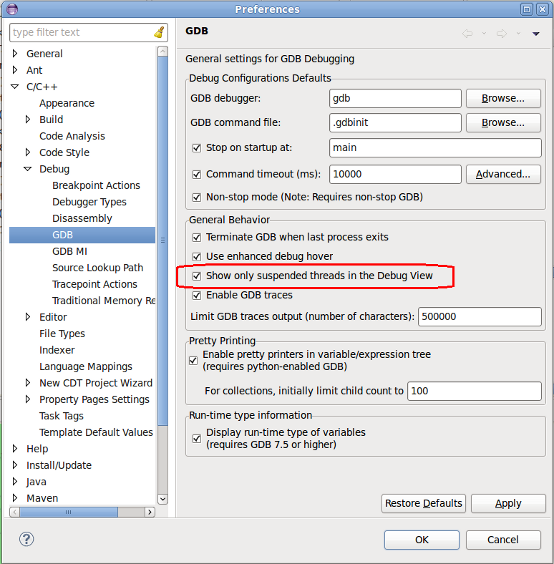
CDT now has an global preference that allows to only show the suspended threads within the Debug view. When dealing with a large number of threads, a user is typically interested by the threads that are being inspected (suspended ones) and does not care about the running ones. Using this preference, all running threads will not be shown in the Debug view. Note that when a thread is stepping it will remain visible, although it is technically running. The process element of the Debug view will show how many threads are currently being filtered from view.
The below example shows the exact same debugging session. The first screenshot only shows suspended threads, while the second shows all threads.
Below shows how to access the preference, which is disabled by default.
This feature was completed through Bug 375585
Multi-select attach dialog
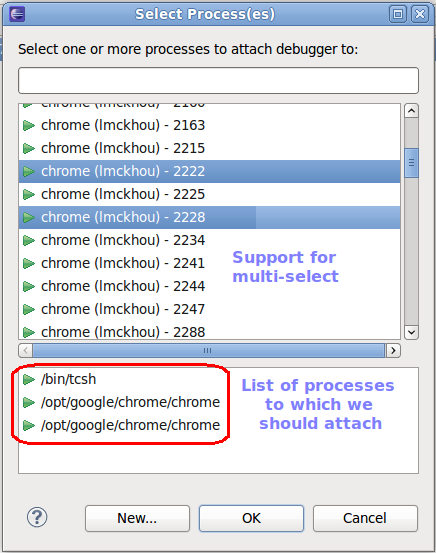
CDT now allows selecting more than one process to attach to in a single user operation. The bottom pane is used to see which processes have been selected. If multi-process debugging is not supported with your debug session (needs GDB >= 7.2 and NonStop enabled), only the first process will be attached to.
This feature was completed through Bug 293679
Default Postmortem file location
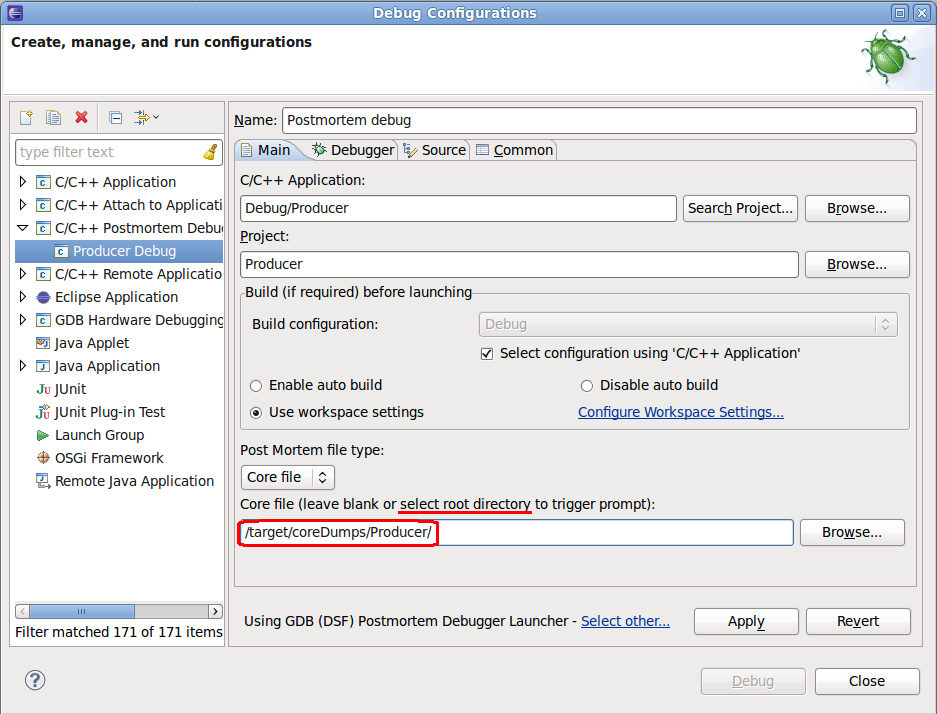
CDT now allows the user to specify a default directory for the location of core files for a postmortem launch when the prompt is triggered. Since a postmortem launch can easily be re-used for different core files of the same binary, this feature helps reduce the amount of navigation needed to select a core file. Note that specifying the actual core file is still supported, as well as leaving the entire field blank, which will also trigger the prompt, but use the default directory for its starting location.
Note that this 'core file' field supports the use of variables such as ${workspace_loc}.
This feature applies to both core files and trace files.
This feature was completed through Bug 362039
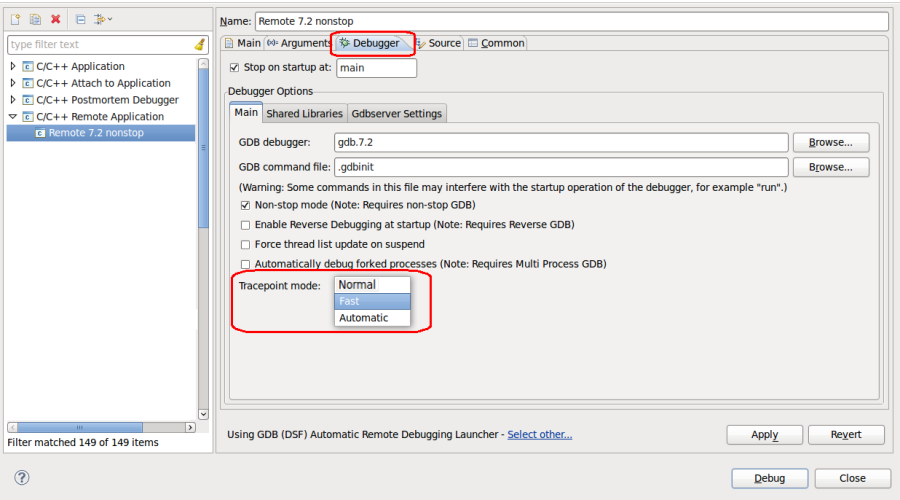
Support for Fast Tracepoints
CDT now allows the user of fast tracepoints, as supported by GDB. Fast tracepoints use an instruction jump instead of a trap for efficiency. Fast tracepoint need a minimum of space to be inserted in the program and therefore, may fail to be set at certain locations. For fast tracepoints to work, a special library called the in-process agent (IPA), must be loaded in the inferior process. This library is built and distributed as an integral part of gdbserver. Please see the GDB documentation for more details.
The user can select between three tracepoint modes in the launch:
- Fast: Only use fast tracepoints. No tracepoint will be planted if a fast tracepoint cannot be used.
- Normal: Only use normal tracepoints.
- Automatic: Attempt to use fast tracepoints. If a fast tracepoint cannot be used, automatically use a normal tracepoint.
This feature was completed through Bug 346320
Enhancements to Tracepoints
With the use of GDB 7.4, some new features are available within Eclipse.
- Live enable/disable of C/C++ Tracepoints
- Tracepoints can now be enabled and disabled at any time after a trace experiment has been started, and will immediately take effect within the ongoing experiment.
- Note: Although GDB 7.4 seems to allow a tracepoint to be created during a trace experiment and will add it to the ongoing experiment, this behavior seems to have some issues. One of which is that deleting a tracepoint during an experiment will not remove that tracepoint from the ongoing experiment. Until this is fixed in GDB, it is recommended that the user stick to enable/disable operations during a tracing experiment.
- Smaller Fast tracepoints
- On 32-bit x86-architectures, fast tracepoints can now be placed at locations with 4-byte instructions, when they were previously limited to locations with instructions of 5 bytes or longer.
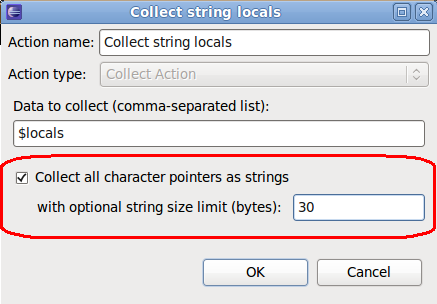
- Tracepoint collecting of Strings
- The tracepoint Collect action now has an option to request to collect character pointers as strings. It tells GDB to effectively dereference pointer-to-character types and collect the bytes of memory up to a zero byte. An optional integer limit sets a bound on the number of bytes that will be collected. This feature was completed through Bug 373707
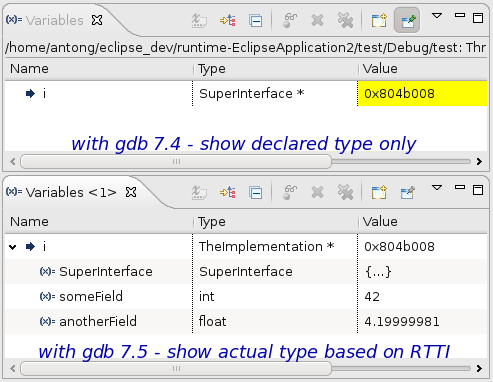
Show the actual variable type based on RTTI
With GDB 7.5.1 or higher CDT could show the actual variable type (not the declared one) in Variables and Expressions Views. Consider the following example:
   struct SuperInterface {
       virtual ~SuperInterface() {}  // enable RTTI for Interface class
   };

   struct TheImplementation : public SuperInterface {
       TheImplementation(int _v1, float _v2)
           : someField(_v1), anotherField(_v2) {}

       int someField;
       float anotherField;
   };


   int main() {
       SuperInterface* i = new TheImplementation(42, 4.2);
       return 0;     // [Launch debug until here]
   }
Launch the debugging session and run until return statement:
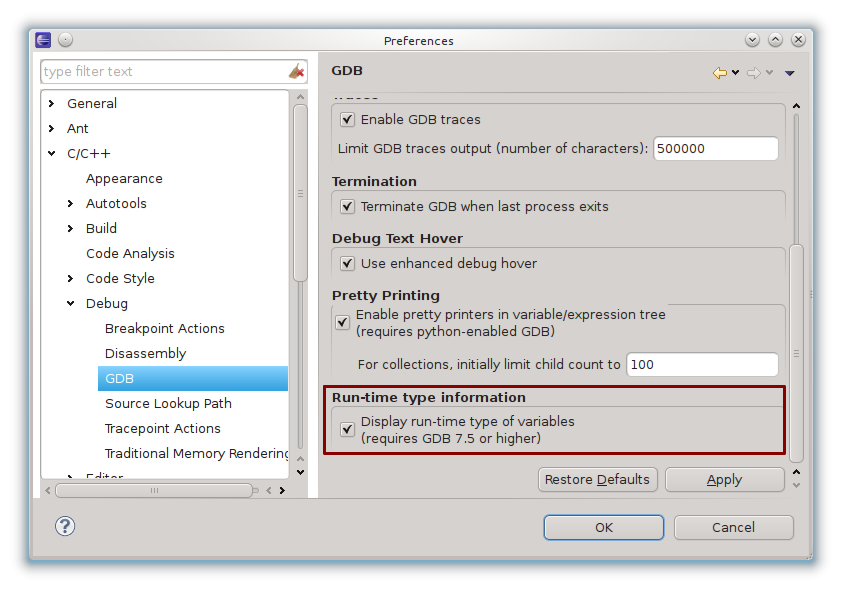
This feature is enabled by default and will work if you have the proper GDB version (7.5.1 or higher) and RTTI generation enabled (enabled by default in gcc), however it could be turned off in preferences:
This feature was completed through Bug 376901 and Bug 377536. Note that a bug was found in GDB 7.5 which could affect the display of other variables or registers. GDB 7.5.1 or higher should be used with this feature.
Build variables support in "C/C++ Application" field of launch configuration
There are also a few new CDT-specific build variables:
- config_name - the name of the active configuration for the project specified as an argument;
- config_description - the description of the active configuration for the project specified as an argument;
This feature was completed through Bug 180256 and Bug 375814.
Support for octal number format in CDI
CDI now also supports to use the octal number format to display the contents of variables, expressions and registers. You can select the octal number format within the Debug preferences. This feature was completed through Bug 370462.
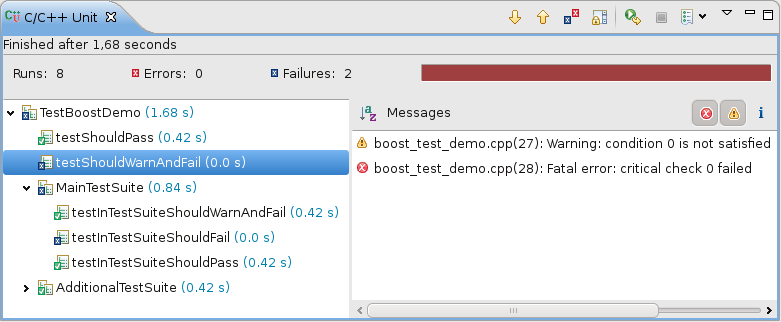
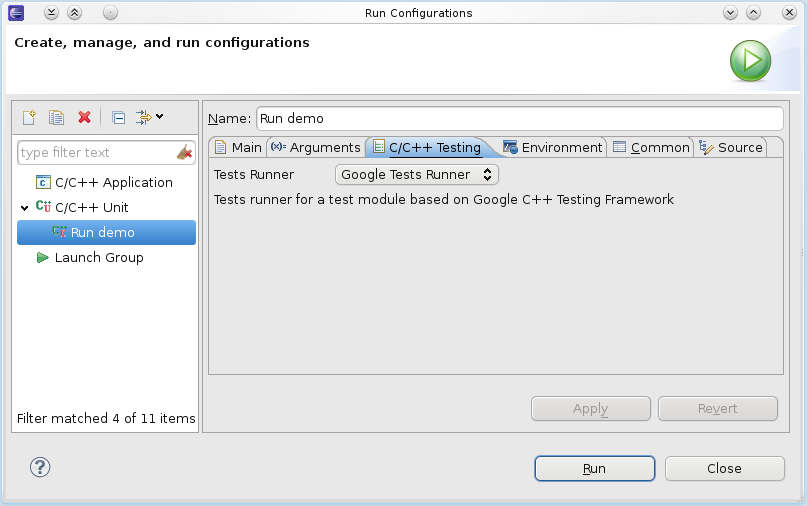
C/C++ Unit Testing Support
Supported features:
- tests running with support of the following frameworks:
- tests hierarchy browsing;
- test messages viewing, filtering by test or test suite; source lookup is also supported;
- testing statistics (total/failed/aborted tests count, red/green bar);
- testing time measurement;
- tests hierarchy filters (show only failed tests);
- running & rerunning only selected tests (not a whole test module);
- start a debug session for the whole test module or only the selected tests;
- test messages filters (by severity);
- test runs history;
- the list of provided tests runners may be easily extended writing a new Tests Runner Plugin.
The HOWTO, known problems and limitation can be found in the corresponding section of CDT FAQ.
This feature was completed through Bug 210366.


