Notice: This Wiki is now read only and edits are no longer possible. Please see: https://gitlab.eclipse.org/eclipsefdn/helpdesk/-/wikis/Wiki-shutdown-plan for the plan.
Thread Analysis
Thread Analysis : Identify threading problem
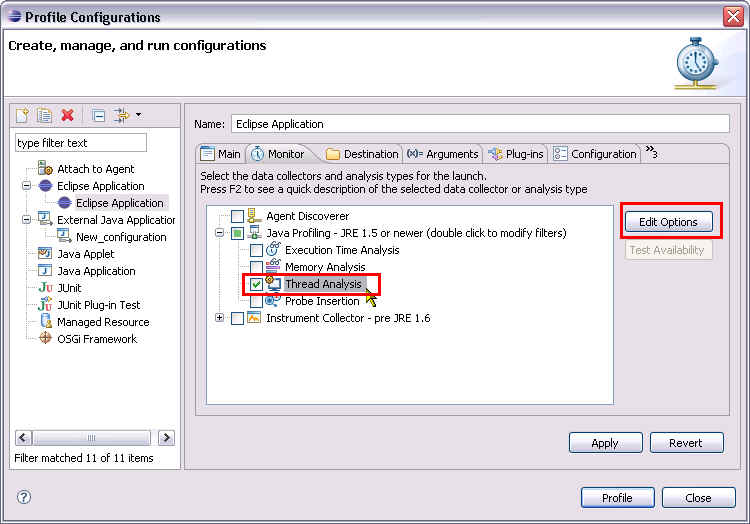
Thread or job problem can be identify with the help of Thread Analysis. Thread Analysis can be enabled in the launch configuration by selecting Thread Analysis type of a Java profiler.
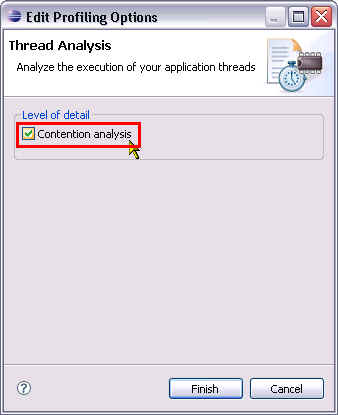
If contention information is required, enable the Contention Analysis option in the Edit Option detail of the analysis type.
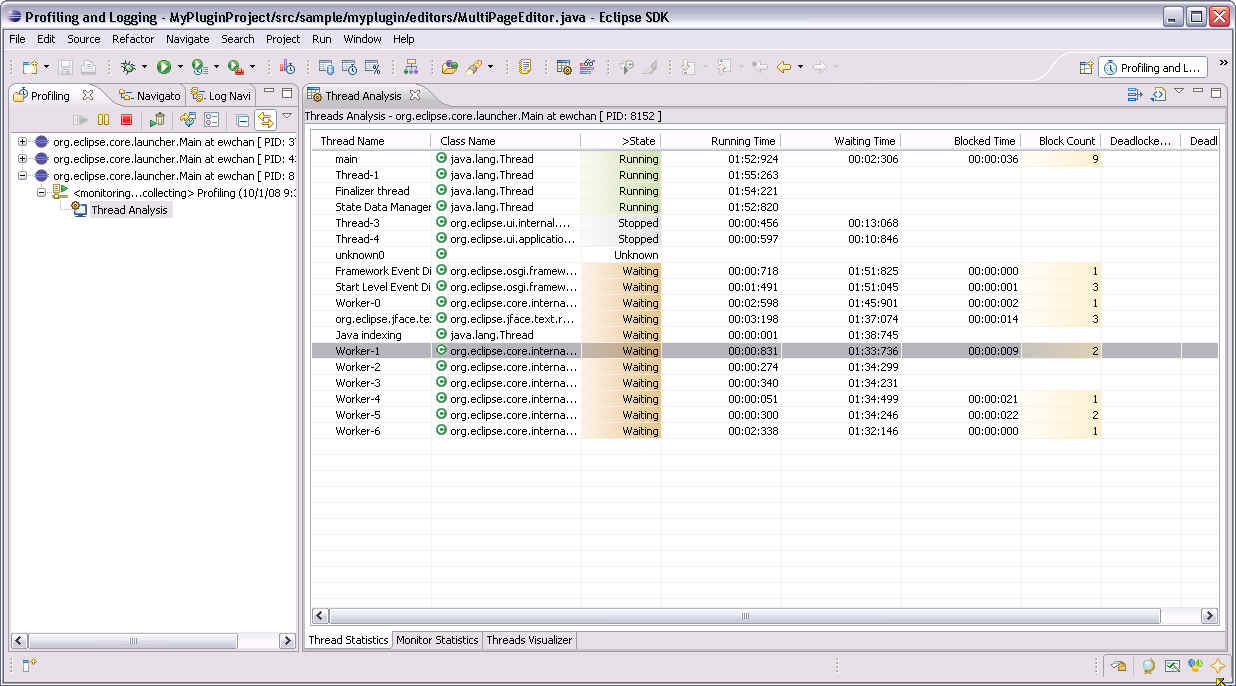
Double-clicking on the profile agent opens the Thread Statistics view which shows thread related information of an application under profiled.
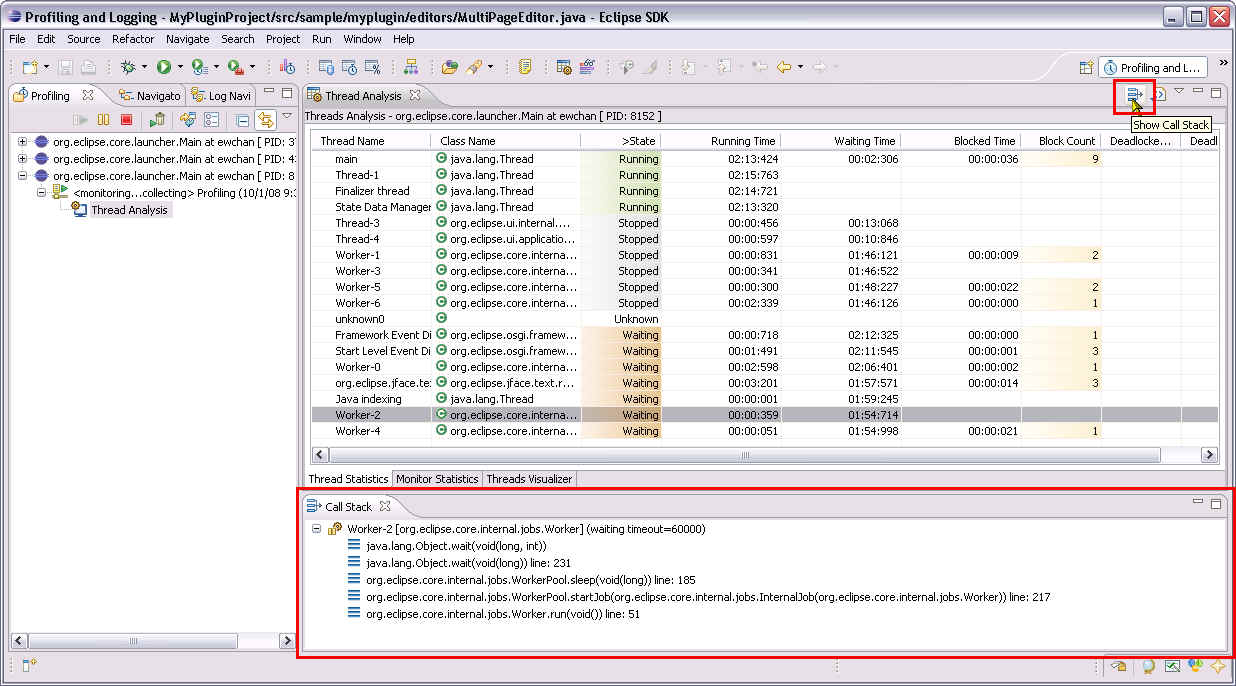
Selecting any thread instance in the table and click Show Call Stack button opens Call Stack view that shows stack information of the selected thread.
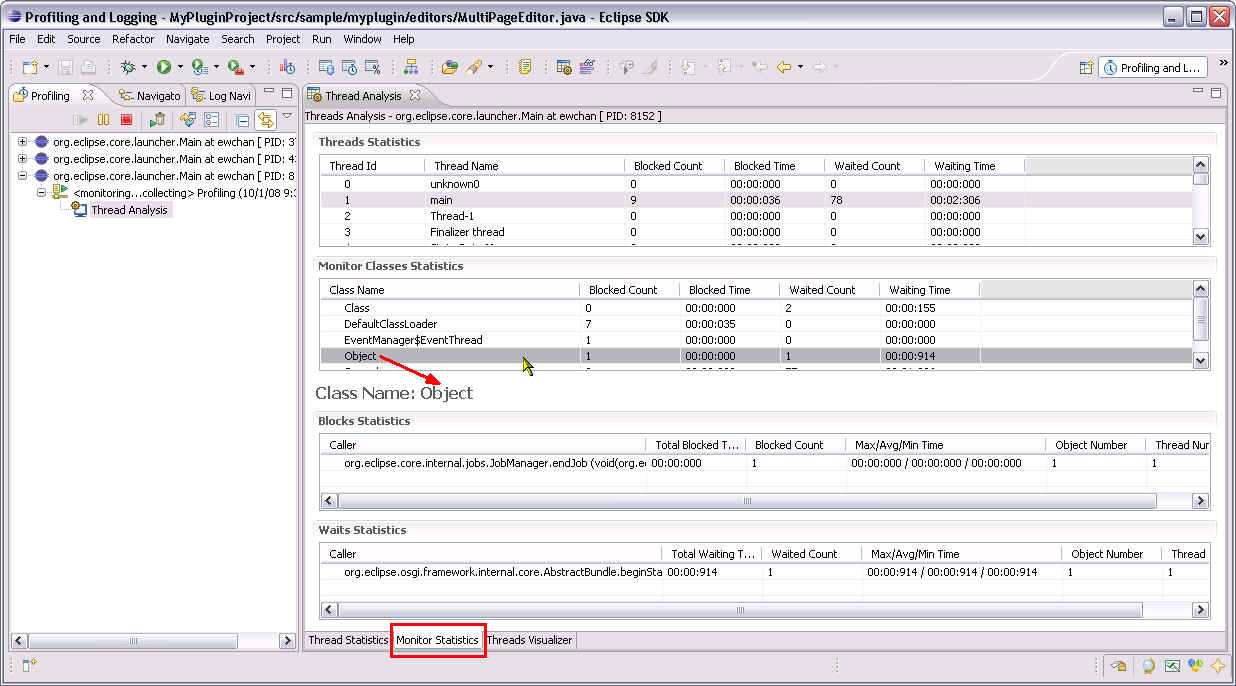
More detail information can be acquired by switching to the Monitor Statistics tab which shows information of class monitored in each thread.
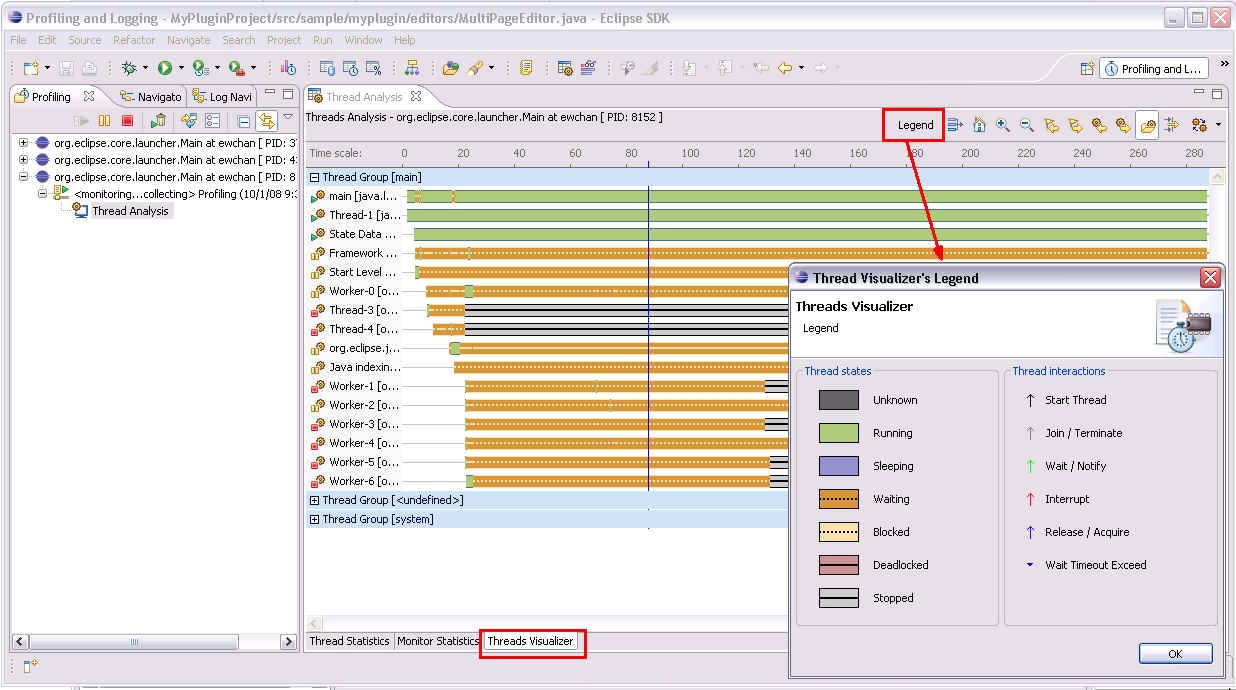
The Threads Visualizer tab shows a graphical representation of the thread analysis, Legend is available in the Legend button.
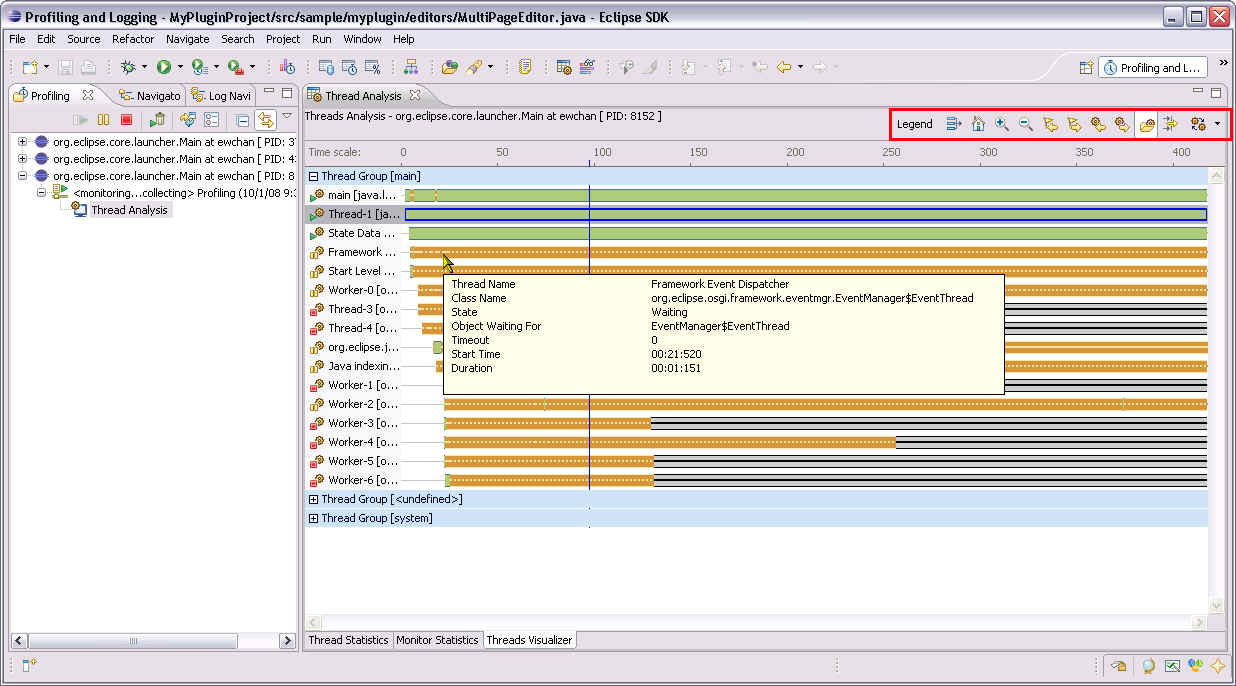
Mouse over any thread in the view shows details about the selection.

