Notice: This Wiki is now read only and edits are no longer possible. Please see: https://gitlab.eclipse.org/eclipsefdn/helpdesk/-/wikis/Wiki-shutdown-plan for the plan.
Profiling configuration
Profiling Configuration
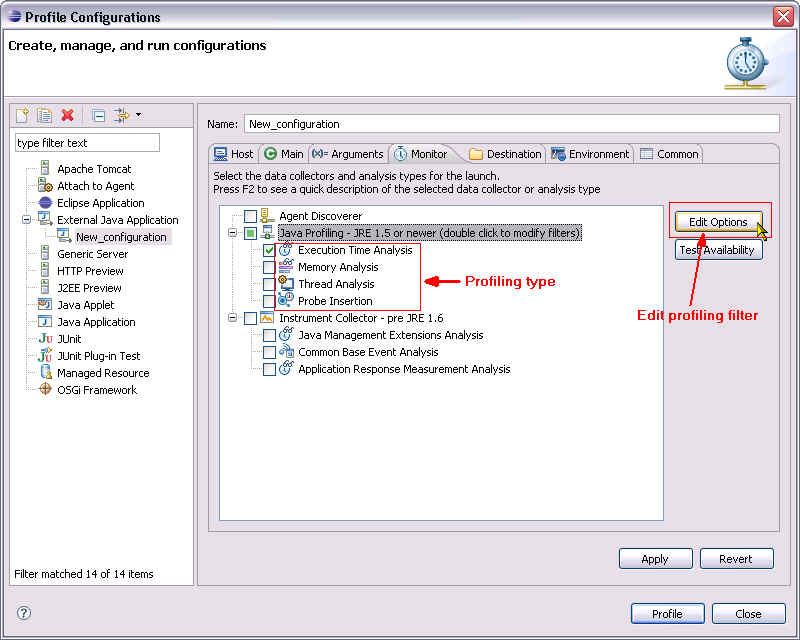
When a profiling session is started, a profile dialog is prompted where configuration for the session is available. There are two main areas of configuration in a profiling session: profiling filter and profiling type. Profiling types, a.k.a. Analysis type, indicate what type of data to be collected. Profiling filters ensure that only relevant details are collected by the data collector and channeled out to the views. Using filters is especially useful when speed and efficiency is critical: the less data there is, the less impact it has on the system, and the faster it can be collected.
Profiling Filter
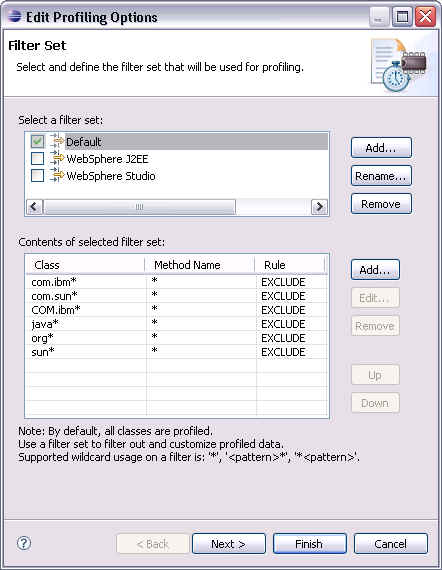
TPTP provides default filters that filter out common and generic packages for profile session in general. User should create or edit an existing filter set and customize the filter configuration that target the package of application under profile.
Consider filter set is read by the data collector and used in the decision of routing the trace data to the workbench. Note that only the first applicable filter is applied and the rest in the list is ignored. When you are specifying filters, ensure that you declare the most specific filter criteria first. For example: If data collector have profiling information of package org.eclipse.samples.myPackage.myClass.myMethod(). With the following filter:
- org.eclipse* * EXCLUDE
- org.eclipse.sample* * INCLUDE
The profiling information will be ignored and not sent to the workbench client as the first filter fits the criteria and its rules is applied. However, with the following filter:
- org.eclipse.sample* * INCLUDE
- org.eclipse* * EXCLUDE
The profiling information will be included and sent to the workbench client as the first filter fits the criteria and its rule is applied.
Notes:
1. When entering a pattern for the package or method name, the pattern must be specified in one of three ways:
- A pattern with no wildcards, e.g. org.eclipse.tptp.
- A pattern with a wildcard at the beginning, e.g. *.sample.myapplication.
- A pattern with a wildcard at the end, e.g. org.eclipse.*.
2. Certain classes will always be visible in the profiling views regardless of the filter settings. The profiling agent will always collect data for objects or classes that are associated with the task being examined while collecting data specific to the task. For example, you specify a filter to collect data for a single class MyUserClass, and specify another filter to exclude the java.lang.* classes. When an instance of MyUserClass is loaded though, it has an associated class definition that gets loaded. This class definition has an associated class object, which is in turn of type java.lang.Class. This results in data collection for the java.lang.Class in addition to the MyUserClass class. This behavior applies to threads as well. The java.lang.Thread class will always show up in the Profiling views because the profiling agent tracks all running threads, and therefore, collects data for objects or classes associated with those threads.
Profiling Type
Profiling Analysis type listed under each profiler or data collector shows what is available and supported by the data collector. Certain profiling types have enhanced option available and can be configured by selecting the type and Edit Option button. Some analysis types are mutually exclusive under single data collector(eg. JRE 1.5 or newer profiler)while other supports multiple analysis types in one single profiling session (eg. pre JRE 1.5 profiler).
Profiling File
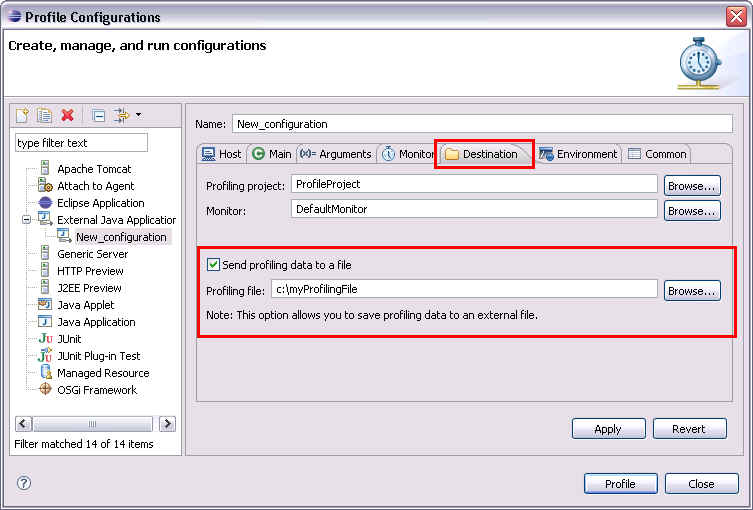
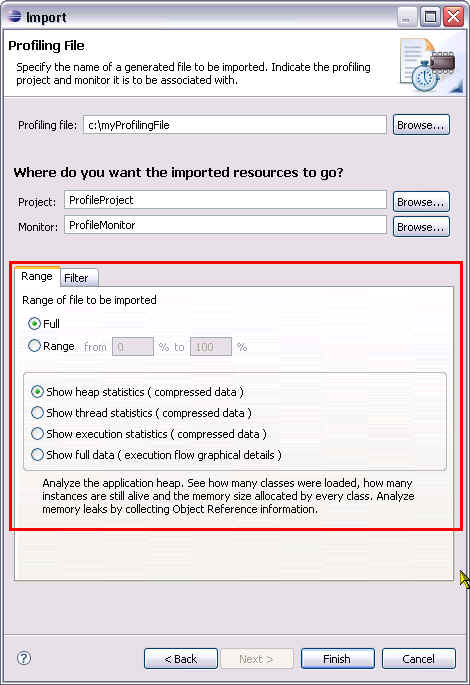
To deal with large profiling data, there is an additional option available for user to route all profiling data collected to a file on the local file system. In the Destination tab of the profiling configuration, there is an option to send profiling data to a file. A file will be created with all the profiling data captured. It is then available for later use or share among team for analysis. The profiling file can be imported back to Eclipse TPTP with the profiling file import option under File > Import... > Profiling and Logging > Profiling File. User has the option to import only a portion of the profiling file as well as the type of data in the file. Filtering is also supported in the import wizard.


