Notice: This Wiki is now read only and edits are no longer possible. Please see: https://gitlab.eclipse.org/eclipsefdn/helpdesk/-/wikis/Wiki-shutdown-plan for the plan.
PTP/designs/2.x/launch platform
Overview
The launch component is responsible for collecting the information required to launch an application, and passing this to the runtime controller to initiate the launch. Both normal and debug launches are handled by this component. Since the parallel computer system may be employing a batch job system, the launch may not result in immediate execution of the application. Instead, the application may be placed in a queue and only executed when the requisite resources become available.
The Eclipse launch configuration system provides a user interface that allows the user to create launch configurations that encapsulate the parameters and environment necessary to run or debug a program. The PTP launch component has extended this functionality to allow specification of the resources necessary for job submission. These resources available are dependent on the particular resource management system in place on the parallel computer system. A customizable launch page is available to allow any types of resources to be selected by the user. These resources are passed to the runtime controller in the form of attributes, and which are in turn passed on to the resource management system.
Normal Launch
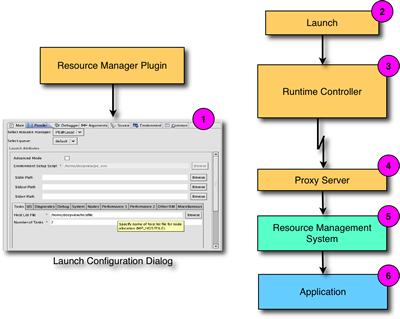
A normal (non-debug) launch proceeds as follows (numbers refer to the diagram).
- The user creates a new launch configuration and fills out the dialog with the information necessary to launch the application
- When the run button is pushed, the launch framework collects all the parameters from the dialog and passes these to the PTP runtime via the submitJob interface on the selected resource manager
- The resource manager passes the launch information to the runtime controller which determines how the launch is to happen. For many types of resource managers, this would involve converting the launch command into a wire protocol and sending to a remote proxy server.
- The proxy server receives the launch command over the wire, and converts it into a form suitable for the target system. This is usually an API or a command-line program.
- The target system resource manager initiates the application launch.
- The application begins execution.
Debug Launch
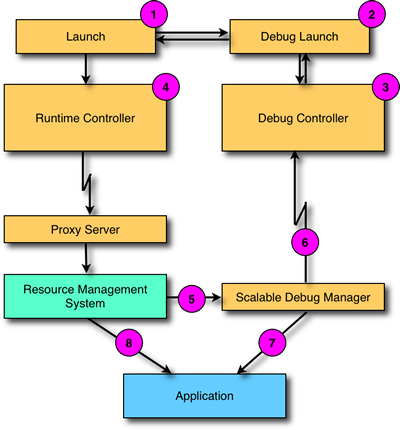
A debug launch starts in the same manner as a non-debug launch, with the user creating a launch configuration and filling in the dialog fields with the relevant information.
- When the user presses the debug button, the launch framework detects that debug mode has been set.
- The debug launcher instantiates the PDI implementation for the selected debugger (specified in the launch configuration Debug tab.)
- The debug controller creates a TCP/IP socked bound to a random port number, and waits for an incoming connection from the external debugger. The port number is passed back to the launch framework.
- The submitJob interface on the selected resource manager is called to pass the launch information to the runtime controller. The launch proceeds in exactly the same manner as a normal launch, except that additional attributes are supplied, including the connection port number. These attributes allow the resource management system to determine how to launch the application under the control of a debugger.
- The resource manager on the target system launches the debugger specified by the attributes. In this case, the debugger launched is the SDM.
- The SDM connects to the debug controller using a port number that was supplied on the command-line. All debugger communication is via this socket.
- In the case where the application is being launched under the control of the debugger, the SDM starts the application processes.
- In the case where the SDM is attaching to an existing application, the resource management system starts the application and passes the relevant connection information to the SDM when it is launched.
Implementation Details
The launch configuration is implemented in package org.eclipse.ptp.launch, which is built on top of Eclipse's launch configuration. It doesn't matter if you start from "Run as ..." or "Debug ...". The launch logic will go from here. What tells from a debugger launch apart from normal launch is a special debug flag.
if (mode.equals(ILaunchManager.DEBUG_MODE))
  // debugger launch
else
  // normal launch
We sketch the steps following the launch operation.
First, a set of parameters/attributes are collected. For example, debugger related parameters such as host, port, debugger path are collected into array dbgArgs.
Then, we will call upon resource manager to submit this job:
final IResourceManager rm = getResourceManager(configuration);
IPJob job = rm.submitJob(attrMgr, monitor);
Please refer to AbstractParallelLaunchConfigurationDelegates for more details.
Resource manager will eventually contact the backend proxy server, and pass in all the attributes necessary to submit the job. As detailed elsewhere, a proxy server usually provides a set of routines to accomplish submitting a job, cancelling a job, monitoring a job etc. for a particular parallel computing environment. Here we will use ORTE proxy server as an example to continue the flow.
ORTE resource manager at the front end (Eclipse side) will have a way to establish connection with ORTE proxy server (implemented by ptp_orte_proxy.c in package org.eclipse.ptp.orte.proxy, and they can communicate through a wire-protocol (2.0 at this point). The logic will switch to method ORTE_SubmitJob.
ORTE packs relevant into a "context" structure, and to create this structure, we invoke OBJ_NEW(). For ORTE to launch a job, it is a two-step process. First it allocates for the job, second, it launches the job. The call ORTE_SPAWN combines these two steps together, which is simpler, and sufficient for the normal job launch. For debug job, the process is more complicated, and we discuss it separately.
apps = OBJ_NEW(orte_app_context_t);
apps-> num_procs = num_procs;
apps-> app = full_path;
apps-> cwd = strdup(cwd);
apps-> env = env;
...
if (debug) {
  rc = debug_spawn(debug_full_path, debug_argc, debug_args, &apps, 1, &ortejobid, &debug_jobid);
} else {
  rc = ORTE_SPAWN(&apps,1, &ortejobid, job_state_callback);
The job_state_callback is a registered callback function with ORTE, and will be invoked when there a a job state change. Also within this callback function, a sendProcessChangeStateEvent will be invoked to notify the Eclipse front for updating UI if necessary.
Now, let's turn our attention on the first case - how a debug job is launched through ORTE, and some of the complications involved.
The general thread of launching is as following: for a N-process job, ORTE will launch N+1 SDM processes. The first N processes are called SDM servers, the N+1 th process is called SDM client (or master), as it will co-ordinate the communication from other SDM servers, and connect back to Eclipse front. Each SDM server will in turn start the real application process, in other words, there is one-to-one mapping between SDM server and real application process.
So there are two set of processes (and two jobs) ORTE needs to be aware of: one set is about SDM servers, the other set is for real applications. Inside debug_spawn() function:
rc = ORTE_ALLOCATE_JOB(app_context, num_context, &jid1, debug_app_job_state_callback);
First, we allocate the job without actually launching it, and the real purpose is to get job id #1, which is for application.
Next, we want to allocate debugger job, but before doing so, we need to create a debugger job context just as we did for application.
	debug_context = OBJ_NEW(orte_app_context_t);
	debug_context->num_procs = app_context[0]->num_procs + 1;
	debug_context->app = debug_path;
	debug_context->cwd = strdup(app_context[0]->cwd);
        ...
	asprintf(&debug_context->argv[i++], "--jobid=%d", jid1);
	debug_context->argv[i++] = NULL;
        ...
Note that we need to pass appropriate job id to debugger - that is the application job id we obtained earlier by doing the allocation. Debugger needs this job id to do appropriate attachment. Once we have the debugger context ready, we allocate for debugger job by:
rc = ORTE_ALLOCATE_JOB(&debug_context, 1, &jid2, debug_job_state_callback);
Note that job id #2 is for the debugger. Finally, we can launch the debugger by invokding ORTE_LAUNCH_JOB():
	if (ORTE_SUCCESS != (rc = ORTE_LAUNCH_JOB(jid2))) {
		OBJ_RELEASE(debug_context);
		ORTE_ERROR_LOG(rc);
		return rc;
	}


