Notice: This Wiki is now read only and edits are no longer possible. Please see: https://gitlab.eclipse.org/eclipsefdn/helpdesk/-/wikis/Wiki-shutdown-plan for the plan.
JSDT/Debug/Rhino/Local Rhino Debugging
| JSDT Debug | |
| Website | |
| Download | |
| Community | |
| Mailing List • Forums • IRC • mattermost | |
| Issues | |
| Open • Help Wanted • Bug Day | |
| Contribute | |
| Browse Source • Project Set File |
Contents
Overview
This page describes how to take advantage of the local Rhino debugging support. There is specific information on how to use context launching, how to create a new launch configuration and what the options for a new launch configuration mean / do.
Rhino JavaScript Launch Configuration
There is more than one way to create a Rhino JavaScript launch configuration. You can create one by hand by opening the launch dialog in debug mode (only) and crafting one, or you can take advantage of context-sensitive launching and have one created for you.
Creating by Hand
To create a new Rhino JavaScript configuration by hand you have to open the launch dialog in debug mode. The Rhino JavaScript configuration type is only available for debug mode, so if you open the launch dialog in run or any other mode it will not be available.
With the launch dialog open you can simply double-click the Rhino JavaScript type in the left hand tree and configure the options as mentioned in the options section.
Using Context Launching
In 3.5 the Eclipse platform introduced the notion of context-sensitive launching, meaning you can quickly launch the current editor or selection by using a key binding (that you define) or by simply pressing the debug toolbar button.
Local Rhino debugging has the necessary hooks to take advantage of context-launching, which allows you to quickly create a launch configuration by:
- pressing the debug toolbar button when the editor for the script you want to debug is open and has focus
- pressing the debug toolbar button when the script you want to debug is select in the Package Explorer or Project Explorer
- pressing the debug toolbar button while holding the Ctrl key and either of the previous selections is true (editor or explorer selection)
- using a key binding while either of the previous selections is true (editor or explorer selection)
Launch Options
The options on the Main tab allow you to specify the script you want to debug and the parameters use to configure the Rhino interpreter. The default options specified for a new configuration will provide you with the most general debugging experience, but you can tailor how the interpreter runs to reproduce specific scenarios.
There are a few options for Rhino which are as follows:
Script
- The script option is required and points to the JavaScript file in you workspace that you wish to debug. The file is checked for existence, so a manually entered path will be validated
ECMA script version to interpret with
- This option allows you to set the ECMA compliance level that Rhino will interpret the script using. For more information on how Rhino uses this option see this link about the option to Rhino and this link about JavaScript language levels.
Rhino optimization level
- Rhino can make certain optimizations when it interprets the script. To find out more about what each optimization means / does check this link.
Strict mode
- This option puts Rhino in strict mode. When in strict mode Rhino will treat some warnings as errors and will report all warnings. It can be a challenge to debug scripts in strict mode, as many more problems are found, most of which terminate interpreting the script.
Log interpreter exceptions
- In certain cases, usually a fatal problem from the interpreter, exceptions will be thrown from Rhino. This option allows them to be forwarded to the Eclipse error log.

The main tab for a local Rhino launch configuration

Include Paths
The Include tab for a Rhino configuration allows you to quickly and easily add additional scripts to be run before the main script.
You have the option to add one or more scripts from the workspace or from the local or extended file system.
Using the Up and Down buttons you can place the scripts in the order you would like them to be run. The script at the top of the listing will be run first. You can also use the Remove button to remove the selected included scripts from the listing.
Any scripts that are added to the include path also have their containing folder automatically added to the source lookup path. For example if you added the script /home/user/myscript.js to the include path, the folder entry for /home/user/ would be added to the source lookup path for you automatically.
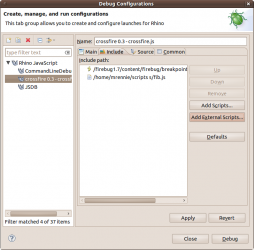
The include tab for a local Rhino launch configuration

Source Lookup
The Source tab allows you to customize where the launch will look for your source. This tab is automatically updated to track the script specified on the Main tab as well as entries on the Include tab.
Any automatically added entries can be changed / removed as you like and and new entries can be added from one of the following locations:
- Archive
- External Archive
- File System Directory
- Java Classpath Variable
- Java Library
- Java Project
- Project
- Working Set
- Workspace
- Workspace Folder
To modify the source lookup path simply use the Add..., Remove... or Edit... buttons. The Default project source lookup entry cannot be modified, as it it directly tied to the script specified on the Main tab. But you can modify and edit any child entries of the Default project entry.

The source tab for a local Rhino launch configuration
