Notice: This Wiki is now read only and edits are no longer possible. Please see: https://gitlab.eclipse.org/eclipsefdn/helpdesk/-/wikis/Wiki-shutdown-plan for the plan.
Composing a Graph
Creating a New Model from STEM's Built in collections of Graphs
Creating a graph in stem involves building a model and adding to it a set of locations (Nodes) and connections between those locations (Edges). STEM comes with a number of built in Models each containing pre-configured graphs. It also comes with pre-configured Models for every country and for every continent. These may be found in the Designer Perspective under the Models tab.
See: Models>Geography
Adding a new disease vector or transmission path between two locations requires adding a new Edge between the two respective nodes.
Composing a Graph
Suppose you want to create a new simulation scenario for some disease involving three countries, e.g., France, Italy, and Spain. STEM comes with models for each country but does not come with a graph for that group of three. We must compose it.
1. Click on your "Example" model to open it in the Resource Set window.
2. Click on the models folder and open the Folders
>STEM>Geography>Political>Country>ESP
3. Drag the model entitled "ESP(0, 1) Full Infrastructure" into your parent "Example" model.
"ESP(0, 1) Full Infrastructure" is the full infrastructure for Spain with admin 0 and admin 1 resolution.
It is itself a graph with containment relationships and adjacency relationships for Spain.
4. Repeat Step 3 for France and Italy
>STEM>Geography>Political>Country>FRA
>STEM>Geography>Political>Country>ITA
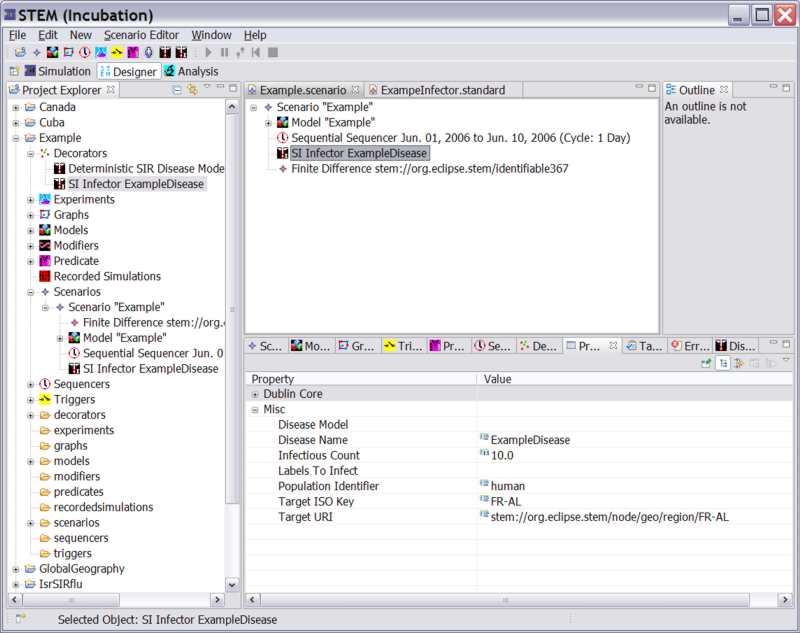
5. Your parent model "Example" will appear next to a blue triangle. If you expand this node by clicking on (+) next to the model, you will see three new blue triangles representing the three country level graphs you added to your model (See Figure 1). However, at this point there are no connections between the three countries you added. These connections or "Common Border" relationships between any two countries must be added once per pair of countries. They may be found under the Graphs tab. Any two way edge is placed in the folder of the country whose three letter country code appears first alphabetically.
Figure 1: Composing a Graph
Adding Edges to Your Graph
1. To add the border between France and Spain select the GRAPHS tab and click on:
>STEM>Geography>Political>Country>ESP
Drag the icon for "Common Border relationship between country ESP and FRA" into your "Example" model. It will appear at the same level in the tree as the countries Spain and France. Note that the Edges connecting Spain and France may be found in the ESP folder because ESP comes before FRA alphabetically.
2. To add the border between France and Italy select the GRAPHS tab and click on:
>STEM>Geography>Political>Country>FRA
Drag the icon for "Common Border relationship between country FRA and ITA
3. Follow the instructions for Creating a new Disease and drag your new Disease into your "Experimental" Model. Note that any disease (or all diseases) appear under the top level MODEL node. See figure 2.
Figure 2: A Disease has been added to the Model
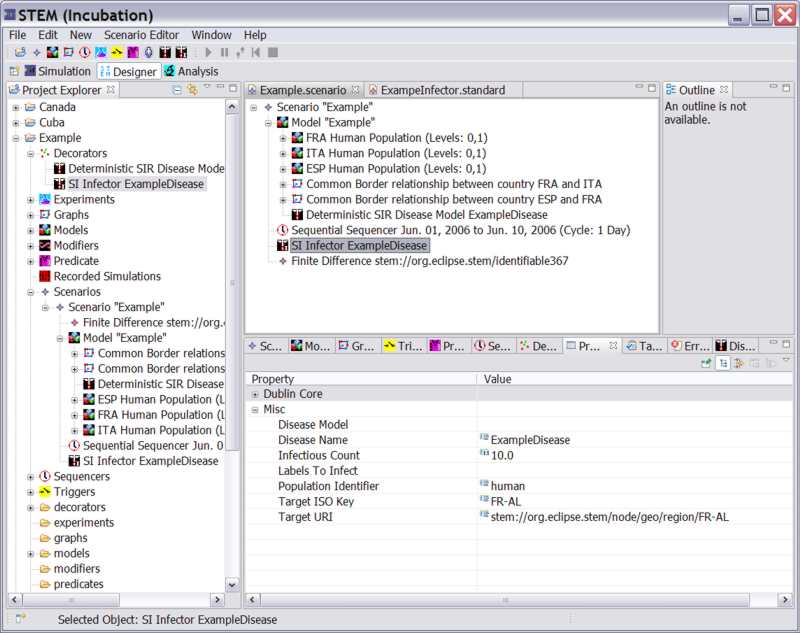
4. Follow the instructions Creating a STEM Scenario. That tutorial will tell you how to add your model to a Scenario. Then follow instructions for Creating a new Sequencer and Creating a new Infector. When you are finished, your graph should appear similar to the one shown in Figure 3 below. The Sequencer, the Infector, and your new "Example" Model are all part of a Scenario node. Expand your top level model node to see the graph of nodes and edges, as well as the disease or disease you have defined.
Figure 3: The Example Scenario is ready to run. See the proper hierarchical structure of this scenario in the Resource Set window.


