Notice: This Wiki is now read only and edits are no longer possible. Please see: https://gitlab.eclipse.org/eclipsefdn/helpdesk/-/wikis/Wiki-shutdown-plan for the plan.
ATF/Help
Ajax Tools Framework Help Contents
- Overview
- Tools
- Tasks
Selected Features
|
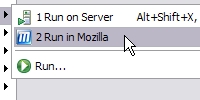
Run your web application in the Embedded Mozilla browser. more... |
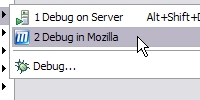
Debug your web application in the Embedded Mozilla browser. more... |
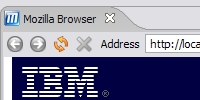
The Embedded Mozilla is a fully functional browser with tighter integration with Eclipse. more... |
|
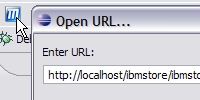
Open the Embedded Mozilla by using the toolbar action available in the Mozilla Perspective. more... |
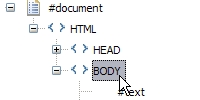
Use the DOM Inspector view to get a live snapshot of the document rendered in the browser. more... |
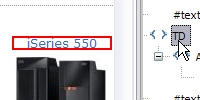
Discovered where a DOM element in the DOM tree is rendered in the browser. more... |
|
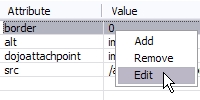
Modify the attributes of the selected DOM element and immediately see the effects in the browser. more... |
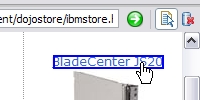
Select elements to inspect by making a selection directly on the browser. more... |
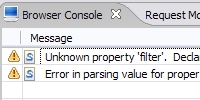
Use the Browser Console view to see error and warning messages logged by the browser. Click on a console entry to open the affected file in an Eclipse editor. more... |
|
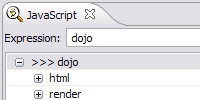
Evaluate JavaScript expressions on the page and interactively inspect the results. more... |
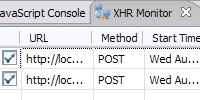
See all the AJAX calls made by your application in the XHR (XML HTTP Request) Monitor view. more... |
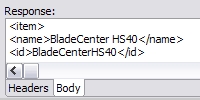
Look at the response and request details for each AJAX call.more...) |
|
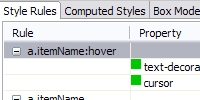
Inspect all the CSS rules and style properties that are applied to the selected DOM element in the CSS view. more... |
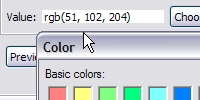
Make changes to the values of style properties and previewed or permanently applied them to the browser. more... |
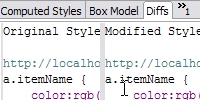
Track all the CSS changes made to later apply them to your application. more...) |
|
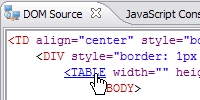
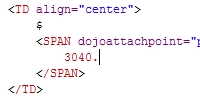
See source text of the selected DOM element and its descendants and use it to navigate the document. more... |
Make text modifications in the DOM Source view and change the content displayed in the browser. more... |
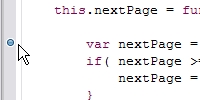
Set breakpoint markers on files located in projects as well as remotely located files for debugging JavaScript. more... |
|
When the JavaScript Debugger is running, interact with the application in the Embedded Mozilla to trigger a breakpoint. more... |
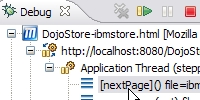
When the JavaScript Debugger encounters a breakpoint, interact with the current call stack using the Debug view. more... |
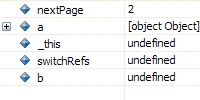
Inspect the variables in scope at each level of the call stack in the Variables view. more... |
|
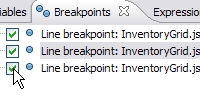
See all the breakpoints that the JavaScript Debugger is observing in the Breakpoints view. more... |
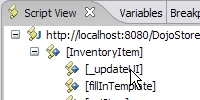
Use the Script View to list all the files that contain JavaScript in the application and add or remove breakpoints. more... |

