Notice: this Wiki will be going read only early in 2024 and edits will no longer be possible. Please see: https://gitlab.eclipse.org/eclipsefdn/helpdesk/-/wikis/Wiki-shutdown-plan for the plan.
VIATRA2/ExtraFeatures/ModelVisualisation
Model Space Visualisation
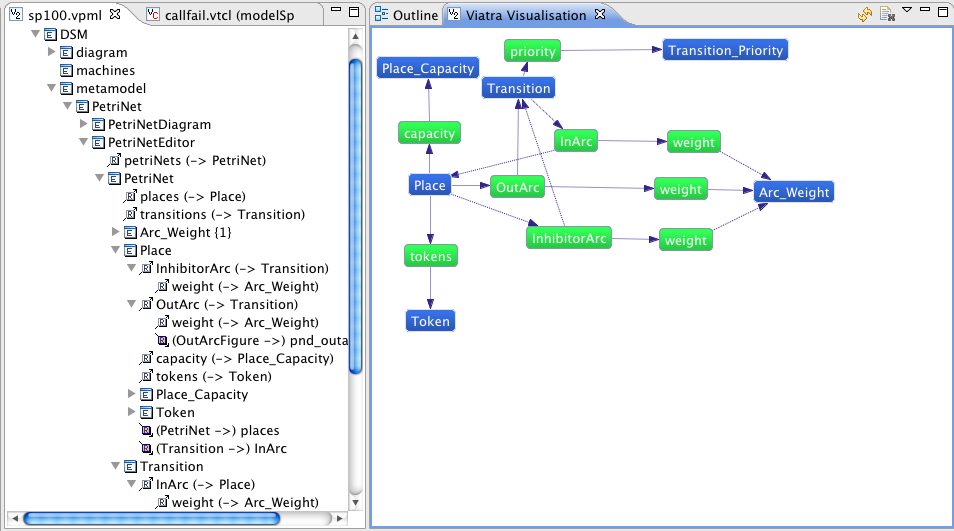
The VIATRA2 framework contains a graph visualisation component for model spaces. Its main feature is automatic layouting using multiple algorithms, and options for manually modifying the created layout.
The visualisation can be started by right-clicking a node in the tree editor, and selecting the Add Selected Subtree to the Graph View item. This adds the subtree selected in the editor to the graph view. It is possible to add multiple elements in a similar fashion, or removing accidentally added elements.
The created visualisation is synchronized with the tree editor and the Properties view, so although there is no direct editing support in the graph, it is possible to make changes and review them in the graph model parallelly.

