Notice: this Wiki will be going read only early in 2024 and edits will no longer be possible. Please see: https://gitlab.eclipse.org/eclipsefdn/helpdesk/-/wikis/Wiki-shutdown-plan for the plan.
Difference between revisions of "Tree Views for Zest"
(New page: This is a project proposal for Google_Summer_of_Code_2009 == Personal Details == Name: Mateusz Matela E-mail: mateusz.matela@gmail.com IRC nick: mmati == Project Summary == The ...) |
|||
| (12 intermediate revisions by 2 users not shown) | |||
| Line 1: | Line 1: | ||
| − | This is a project | + | This is the wiki page for a project [[Google_Summer_of_Code_2009]] |
| + | * Student: [mailto:mateusz.matela@gmail.com Mateusz Matela] (IRC: mmati) | ||
| + | * Mentor: Ian Bull | ||
| + | * Source: [http://eclipse-soc.googlecode.com/svn/trunk/2009-treeviewsforzest http://eclipse-soc.googlecode.com/svn/trunk/2009-treeviewsforzest] | ||
| − | == | + | == Abstract == |
| − | + | The goal of this project is to provide two additional viewers into [http://www.eclipse.org/gef/zest/ Zest] project: Space Tree and Treemap. Space Tree is a powerful form of visualization for large sets of tree-structured data, that concentrates on dynamic rescaling and hiding of branches. Treemap is a well known visualization method using nested rectangles, which areas correspond to some aspects of presented data. This project will implement this idea in a traditional form but also try to experiment on it. | |
| − | + | == Detailed Description == | |
| − | + | === Space Tree === | |
| − | + | Space Tree is presented [http://www.cs.umd.edu/hcil/spacetree/ here]. The idea of presenting parts of a tree by scaling and hiding its parts is simple yet powerful. The [http://hcil.cs.umd.edu/trs/2002-05/2002-05.pdf paper] publicized on the site provides a lot of information on what presentation methods are preferable to the user and which just look cool without increasing usability. Generally I'm going to stick to this advice, but to some extend I also want to try some new ideas. For example I think it won't harm to use some transparency effects while hiding a subtree (although I don't know yet whether the underlaying graphic libraries allow transparency). I think a good way to present the Space Tree viewer in action is to add it to the plug-in dependency visualization project (the Plug-in Dependency View in SDK is based on a tree after all). | |
| − | + | === Treemap === | |
| + | The second viewer I'd like to provide is [http://en.wikipedia.org/wiki/Treemap Treemap]. One practical use of this presentation method I've seen is to show sizes of files and folders on disk. Personally, I never liked Treemaps because the constraint of all areas being perfect rectangles tiling a bigger rectangle seems unnatural and unnecessary to me. Its only advantage I can see is that it's easier to put labels on the tiles. But in most applications I've seen tiles aren't even labeled. That's why I'd like to try some other forms of Treemap in addition to the traditional one. | ||
| − | == | + | ==== Circle View ==== |
| − | I | + | One idea is to use circles. The graph area will have some empty spaces between circles, but I think it will look more natural. If smaller circles are put in the empty space between bigger circles, the whole picture will resemble foam (or fractals :)). |
| + | Subtrees can be showed as a set of smaller circles inside a bigger circle. This requires either to break the rule that the area of a node is the sum of its children area, or to not show all the children. This might be a problem in some uses. Another option is to show a node's children in a form of pie chart, but I think this would cause too much inconsistency. Also, the algorithm for placing the circles so that they don't leave a lot of empty space will probably be complicated. But I think finding an approximate solution will be enough to make the graph look nice. It's worth to note that the circles won't have to be completely repositioned if their sizes change (it would only cause some more empty space). All in all, I think it's worth to implement this idea. | ||
| − | + | ==== Polygon View ==== | |
| − | + | Another option is to form something resembling a [http://en.wikipedia.org/wiki/Voronoi_diagram Voronoi diagram]. Of course the cells won't have to completely fulfill Voronoi diagram's properties, the main idea is to resign from rectangles and use more irregular polygons. I think this will allow more balance in the picture in comparison to traditional Treemaps, where usually there are a few big tiles on one side and all the small tiles are crowded in the corner. This method also won't be vulnerable to changes of cell sizes (it would have to resize all the cells, but without changing their positions). Again, designing an algorithm to create charts that look good is quite a challenge but I think I can manage to find a reasonably effective solution. | |
| − | |||
| − | |||
| − | + | All the implementations of Treemaps will also require a mechanism for cutting out subtrees that are too deep and zooming into selected nodes as it will not always be possible to show all leaves of the tree in a readable fashion. The exemplary application for Treemap will be a simple disk-usage presentation. | |
| − | + | To sum it up, I think the Space Tree viewer will be very useful as its functionality has been tested in aforementioned paper. The Treemap, and especially the last two presentation methods are more risky, but also more interesting :) | |
| − | + | == Deliverables == | |
| − | + | * Redesigned the model for layout algorithms [[Image:Ok green.gif]] {{bug|283083}} | |
| + | * Ported existing layout algorithms into new model [[Image:Ok green.gif]] {{bug|283179}}, {{bug|283244}} | ||
| + | * Space Tree {{bug|277534}} | ||
| + | ** Collapsing nodes into ''subgraphs'' [[Image:Ok green.gif]]<br>''Subgraph'' is a set of nodes that should be hidden at the moment. For example, in case of a tree when a node is collapsed, all of its descendants should be hidden. It can be accomplished by putting them into a ''subgraph''. This operation is called ''pruning''. This should not be confused with ''expanding'' and ''collapsing'' of nodes, as these are different kind of operation, managed by separate classes (currently there are two implementations of '''ExpandCollapseManagers''': one for SpaceTree and one for Directed Acyclic Graph). The relation is that when ''expand'' or ''collapse'' operation is requested on a node, it may result in ''pruning'' and/or ''unpruning'' some other nodes.<br>Subgraph can do as little as hiding the nodes contained in it (that's the default implementation), or put some additional information about ''pruned'' elements in the Graph. There are following types of ''subgraphs'': | ||
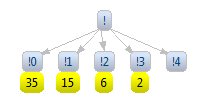
| + | *** '''LabelSubgraph''' - each subgraph is represented a separate graph item: a label showing the number of nodes contained within it. It can be easily subclassed to show other kind of information.<br>[[Image:Zest-tree-subgraph-label.png]] | ||
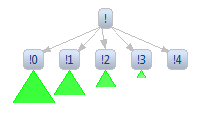
| + | *** '''TriangleSubgraph''' - each subgraph is represented as a triangle. It's designed specifically to work with SpaceTreeLayoutAlgorithm (see below) and assumes that nodes ''pruned'' inside it form a tree structure. Properties of this structure are visualized by properties of the triangle. Height of the triangle corresponds to the height of the tree, the length of the triangle's base corresponds to the total number of leaves in the tree and the luminance of the triangle's color corresponds to average number of children for each node in the tree (which can be understood as the density).<br>[[Image:Zest-tree-subgraph-triangle.png]] | ||
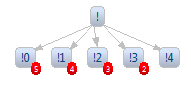
| + | *** '''PrunedSuccessorsSubgraph''' - this implementation adds little labels to ''unpruned'' nodes showing how many direct successors of each node is ''pruned''.<br>[[Image:Zest-tree-subgraph-successors.png]] | ||
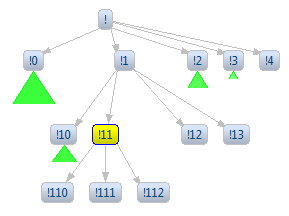
| + | **SpaceTree layout [[Image:Ok green.gif]]<br> | ||
| + | *** It keeps track of nodes positions all the time, always trying to form a nice tree structure. This means movement of nodes with mouse is somehow restricted (you can move a node within its current layer, but only if doesn't cause nodes to be pushed out of graph area). | ||
| + | *** When ''expand'' operation is requested on a node, this node is centered and its subtree is shown, layer by layer, as long as there's enough space (other parts of the tree can be collapsed to extend available space). | ||
| + | *** All layout changes are shown with cool animation effects. Unfortunately, I can't show these on a screenshot - you'll have to try it out yourself ;)<br>[[Image:Zest-tree-layout-spacetree.png]] | ||
| + | **Layout for Directed Acyclic Graph [[Image:Ok green.gif]] - This layout was designed with [[http://www.eclipse.org/pde/incubator/dependency-visualization/index.php Plug-in Dependency Visualization]] in mind. The layout algorithm itself is slightly improved version of the original algorithm from that project. At the beginning only the nodes at the top (these which have no predecessors) are ''expanded''. They're always visible. The other nodes are visible if they have at least one direct predecessor which is visible and ''expanded''. So sometimes you can see a connection coming out of a ''collapsed'' node if the target node is visible because of its other predecessor. There's an option to hide such connections.<br>[[Image:Zest-tree-layout-dag.png]] | ||
| + | *Treemaps [[Image:Glass.gif]] {{bug|277537}} - POSTPONED | ||
| + | **Rectangle View features - TBA | ||
| + | **Circle View features - TBA | ||
| + | **Polygon View features - TBA | ||
| − | + | To see if there are other related bugs, use this [https://bugs.eclipse.org/bugs/buglist.cgi?query_format=advanced&short_desc_type=allwordssubstr&short_desc=%5Btree%5D&classification=Tools&product=GEF&component=Zest query]. | |
| + | |||
| + | == Running Samples == | ||
| + | |||
| + | To get started, check out all four items from SVN (http://eclipse-soc.googlecode.com/svn/trunk/2009-treeviewsforzest, User: anonymous, empty password) as separate projects into eclipse workspace. You should also have GEF and Draw2d installed (you can download them by typing http://download.eclipse.org/tools/gef/updates/releases/ in installation manager). | ||
| + | |||
| + | The '''Examples''' folder contains some demo applications. Most of them are just conversions of older Zest example programs to the new API. Features introduced with this project are shown in: | ||
| + | * '''SpaceTreeExample''' - SpaceTreeLayout on an example tree structure | ||
| + | * '''SpaceTreeBuilding''' - you can add and remove nodes and connections, observing how the layout algorithm reacts to these changes | ||
| + | * '''DAGExample''' - simple example of Directed Acyclic Graph | ||
| + | * '''SpringLayoutProgress''' - shows how new API can be used to create layout algorithms reacting to changes in real time | ||
| + | |||
| + | '''org.eclipse.pde.visualization.dependency''' is a modified version of [http://www.eclipse.org/pde/incubator/dependency-visualization/index.php Plug-in Dependency Visualizualization Tool] that uses new DAG layout algorithm. | ||
| + | |||
| + | == Useful Resources == | ||
| + | |||
| + | Here I'll put links to cool sites, articles and other resources that I find inspiring. You're welcome to add your propositions. | ||
| + | * [http://www.cs.umd.edu/hcil/treemap-history/ Treemap history] - everything about treemaps, many of the following links can be found there | ||
| + | * [http://www.cs.umd.edu/hcil/treemap-history/Treemaps-Java-Algorithms.zip Treemap library in java (zip)] - it's released under Mozilla Public Licence, so I guess we can use it; there's also an [http://www.cs.umd.edu/hcil/treemap-history/java_algorithms/LayoutApplet.html applet] demonstrating how it works | ||
| + | * [http://lip.sourceforge.net/ctreemap.html Circular Treemaps] - cool screenshots of circular maps, a sample application can be downloaded [http://sourceforge.net/project/showfiles.php?group_id=83756 here] | ||
| + | * [http://kops.ub.uni-konstanz.de/volltexte/2007/2417/ Voronoi Treemaps for the Visualization of Software Metrics] - a smart way to generate Voronoi treemaps | ||
| + | * [http://people.csail.mit.edu/konak/papers/socg_2008-circular_partitions_with_applications_to_visualization_and_embeddings.html Circular Partitions with Applications to Visualization and Embeddings] - another cool Voronoi-like treemaps | ||
| + | * [http://www.touchgraph.com/TGGoogleBrowser.html TouchGraph Google Browser] - visualization of Google search results (there's also a [http://sourceforge.net/projects/touchgraph free library] with the same name) | ||
== Comments, suggestions, ideas... == | == Comments, suggestions, ideas... == | ||
Feel free to add your thoughts:) | Feel free to add your thoughts:) | ||
| + | |||
| + | |||
| + | |||
| + | |||
| + | ---- | ||
| + | |||
| + | [[Category:SOC]] | ||
| + | [[Category:GEF]] | ||
Latest revision as of 16:51, 31 August 2009
This is the wiki page for a project Google_Summer_of_Code_2009
- Student: Mateusz Matela (IRC: mmati)
- Mentor: Ian Bull
- Source: http://eclipse-soc.googlecode.com/svn/trunk/2009-treeviewsforzest
Contents
Abstract
The goal of this project is to provide two additional viewers into Zest project: Space Tree and Treemap. Space Tree is a powerful form of visualization for large sets of tree-structured data, that concentrates on dynamic rescaling and hiding of branches. Treemap is a well known visualization method using nested rectangles, which areas correspond to some aspects of presented data. This project will implement this idea in a traditional form but also try to experiment on it.
Detailed Description
Space Tree
Space Tree is presented here. The idea of presenting parts of a tree by scaling and hiding its parts is simple yet powerful. The paper publicized on the site provides a lot of information on what presentation methods are preferable to the user and which just look cool without increasing usability. Generally I'm going to stick to this advice, but to some extend I also want to try some new ideas. For example I think it won't harm to use some transparency effects while hiding a subtree (although I don't know yet whether the underlaying graphic libraries allow transparency). I think a good way to present the Space Tree viewer in action is to add it to the plug-in dependency visualization project (the Plug-in Dependency View in SDK is based on a tree after all).
Treemap
The second viewer I'd like to provide is Treemap. One practical use of this presentation method I've seen is to show sizes of files and folders on disk. Personally, I never liked Treemaps because the constraint of all areas being perfect rectangles tiling a bigger rectangle seems unnatural and unnecessary to me. Its only advantage I can see is that it's easier to put labels on the tiles. But in most applications I've seen tiles aren't even labeled. That's why I'd like to try some other forms of Treemap in addition to the traditional one.
Circle View
One idea is to use circles. The graph area will have some empty spaces between circles, but I think it will look more natural. If smaller circles are put in the empty space between bigger circles, the whole picture will resemble foam (or fractals :)). Subtrees can be showed as a set of smaller circles inside a bigger circle. This requires either to break the rule that the area of a node is the sum of its children area, or to not show all the children. This might be a problem in some uses. Another option is to show a node's children in a form of pie chart, but I think this would cause too much inconsistency. Also, the algorithm for placing the circles so that they don't leave a lot of empty space will probably be complicated. But I think finding an approximate solution will be enough to make the graph look nice. It's worth to note that the circles won't have to be completely repositioned if their sizes change (it would only cause some more empty space). All in all, I think it's worth to implement this idea.
Polygon View
Another option is to form something resembling a Voronoi diagram. Of course the cells won't have to completely fulfill Voronoi diagram's properties, the main idea is to resign from rectangles and use more irregular polygons. I think this will allow more balance in the picture in comparison to traditional Treemaps, where usually there are a few big tiles on one side and all the small tiles are crowded in the corner. This method also won't be vulnerable to changes of cell sizes (it would have to resize all the cells, but without changing their positions). Again, designing an algorithm to create charts that look good is quite a challenge but I think I can manage to find a reasonably effective solution.
All the implementations of Treemaps will also require a mechanism for cutting out subtrees that are too deep and zooming into selected nodes as it will not always be possible to show all leaves of the tree in a readable fashion. The exemplary application for Treemap will be a simple disk-usage presentation.
To sum it up, I think the Space Tree viewer will be very useful as its functionality has been tested in aforementioned paper. The Treemap, and especially the last two presentation methods are more risky, but also more interesting :)
Deliverables
- Redesigned the model for layout algorithms
 bug 283083
 - Ported existing layout algorithms into new model bug 283179, bug 283244
- Space Tree bug 277534
- Collapsing nodes into subgraphs
Subgraph is a set of nodes that should be hidden at the moment. For example, in case of a tree when a node is collapsed, all of its descendants should be hidden. It can be accomplished by putting them into a subgraph. This operation is called pruning. This should not be confused with expanding and collapsing of nodes, as these are different kind of operation, managed by separate classes (currently there are two implementations of ExpandCollapseManagers: one for SpaceTree and one for Directed Acyclic Graph). The relation is that when expand or collapse operation is requested on a node, it may result in pruning and/or unpruning some other nodes.
Subgraph can do as little as hiding the nodes contained in it (that's the default implementation), or put some additional information about pruned elements in the Graph. There are following types of subgraphs:- LabelSubgraph - each subgraph is represented a separate graph item: a label showing the number of nodes contained within it. It can be easily subclassed to show other kind of information.
- TriangleSubgraph - each subgraph is represented as a triangle. It's designed specifically to work with SpaceTreeLayoutAlgorithm (see below) and assumes that nodes pruned inside it form a tree structure. Properties of this structure are visualized by properties of the triangle. Height of the triangle corresponds to the height of the tree, the length of the triangle's base corresponds to the total number of leaves in the tree and the luminance of the triangle's color corresponds to average number of children for each node in the tree (which can be understood as the density).
- PrunedSuccessorsSubgraph - this implementation adds little labels to unpruned nodes showing how many direct successors of each node is pruned.
- LabelSubgraph - each subgraph is represented a separate graph item: a label showing the number of nodes contained within it. It can be easily subclassed to show other kind of information.
- SpaceTree layout
- It keeps track of nodes positions all the time, always trying to form a nice tree structure. This means movement of nodes with mouse is somehow restricted (you can move a node within its current layer, but only if doesn't cause nodes to be pushed out of graph area).
- When expand operation is requested on a node, this node is centered and its subtree is shown, layer by layer, as long as there's enough space (other parts of the tree can be collapsed to extend available space).
- All layout changes are shown with cool animation effects. Unfortunately, I can't show these on a screenshot - you'll have to try it out yourself ;)
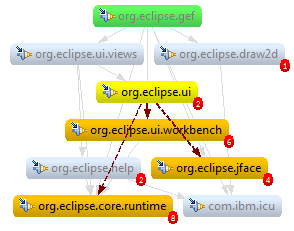
- Layout for Directed Acyclic Graph - This layout was designed with [Plug-in Dependency Visualization] in mind. The layout algorithm itself is slightly improved version of the original algorithm from that project. At the beginning only the nodes at the top (these which have no predecessors) are expanded. They're always visible. The other nodes are visible if they have at least one direct predecessor which is visible and expanded. So sometimes you can see a connection coming out of a collapsed node if the target node is visible because of its other predecessor. There's an option to hide such connections.
- Collapsing nodes into subgraphs
- Treemaps
 bug 277537 - POSTPONED
- Rectangle View features - TBA
- Circle View features - TBA
- Polygon View features - TBA


To see if there are other related bugs, use this query.
Running Samples
To get started, check out all four items from SVN (http://eclipse-soc.googlecode.com/svn/trunk/2009-treeviewsforzest, User: anonymous, empty password) as separate projects into eclipse workspace. You should also have GEF and Draw2d installed (you can download them by typing http://download.eclipse.org/tools/gef/updates/releases/ in installation manager).
The Examples folder contains some demo applications. Most of them are just conversions of older Zest example programs to the new API. Features introduced with this project are shown in:
- SpaceTreeExample - SpaceTreeLayout on an example tree structure
- SpaceTreeBuilding - you can add and remove nodes and connections, observing how the layout algorithm reacts to these changes
- DAGExample - simple example of Directed Acyclic Graph
- SpringLayoutProgress - shows how new API can be used to create layout algorithms reacting to changes in real time
org.eclipse.pde.visualization.dependency is a modified version of Plug-in Dependency Visualizualization Tool that uses new DAG layout algorithm.
Useful Resources
Here I'll put links to cool sites, articles and other resources that I find inspiring. You're welcome to add your propositions.
- Treemap history - everything about treemaps, many of the following links can be found there
- Treemap library in java (zip) - it's released under Mozilla Public Licence, so I guess we can use it; there's also an applet demonstrating how it works
- Circular Treemaps - cool screenshots of circular maps, a sample application can be downloaded here
- Voronoi Treemaps for the Visualization of Software Metrics - a smart way to generate Voronoi treemaps
- Circular Partitions with Applications to Visualization and Embeddings - another cool Voronoi-like treemaps
- TouchGraph Google Browser - visualization of Google search results (there's also a free library with the same name)
Comments, suggestions, ideas...
Feel free to add your thoughts:)