Notice: this Wiki will be going read only early in 2024 and edits will no longer be possible. Please see: https://gitlab.eclipse.org/eclipsefdn/helpdesk/-/wikis/Wiki-shutdown-plan for the plan.
Difference between revisions of "Trace Compass/News/NewIn31"
(→Linux Performance Counter Columns) |
(→Linux Performance Counter Columns) |
||
| (2 intermediate revisions by 2 users not shown) | |||
| Line 20: | Line 20: | ||
[[Image:PerfCounterEventsTable.png]] | [[Image:PerfCounterEventsTable.png]] | ||
| + | |||
| + | = Linux Performance Counter Visualization = | ||
| + | A new view has been added to visualize Linux Performance counters from LTTng traces that have Perf counters added to the event context. The new '''Counters''' view provides a checkbox tree to select which counters to display in the chart beside. | ||
| + | |||
| + | [[Image:CountersView.png]] | ||
| + | |||
| + | = Persist Expanded/Collapsed State Of Timegraph Entries = | ||
| + | The expanded/collapsed state of timegraph entries is restored when switching back and forth between traces. | ||
| + | |||
| + | = State System performance improvements = | ||
| + | The State History Tree (data structure used for storing analysis results and persisting results on disk) has benefited from performance improvements: | ||
| + | It takes less time to build it and it uses at least 2 times less space on disk. It's performance no longer degrades when multiple time series are stored (tread bombs for example). | ||
| + | Moreover, values are indexed on their keys in addition to their times, which contributes to speeding up queries. | ||
| + | Detailed performance benchmarks are visible at [http://istmffastyet.dorsal.polymtl.ca/] | ||
| + | |||
| + | = Virtual Time Graph Views = | ||
| + | The time graph views are now virtualized, which means that only visible items are queried and rendered when navigating the view. | ||
| + | This results in at least a 20% performance gain for most views. | ||
| + | The Control Flow View and Resources View also benefit from new backend queries which make them even faster. | ||
= Bugs fixed in the 3.1.0 release = | = Bugs fixed in the 3.1.0 release = | ||
See Bugzilla report [https://bugs.eclipse.org/bugs/buglist.cgi?bug_status=RESOLVED&bug_status=CLOSED&classification=Tools&product=Tracecompass&query_format=advanced&resolution=FIXED&target_milestone=3.1.0 Bugs Fixed in Trace Compass 3.1.0] | See Bugzilla report [https://bugs.eclipse.org/bugs/buglist.cgi?bug_status=RESOLVED&bug_status=CLOSED&classification=Tools&product=Tracecompass&query_format=advanced&resolution=FIXED&target_milestone=3.1.0 Bugs Fixed in Trace Compass 3.1.0] | ||
Revision as of 16:41, 28 August 2017
Contents
- 1 Time-based trace selection for experiments
- 2 Time-based trace import
- 3 Multiple symbol mapper support
- 4 Linux Performance Counter Columns
- 5 Linux Performance Counter Visualization
- 6 Persist Expanded/Collapsed State Of Timegraph Entries
- 7 State System performance improvements
- 8 Virtual Time Graph Views
- 9 Bugs fixed in the 3.1.0 release
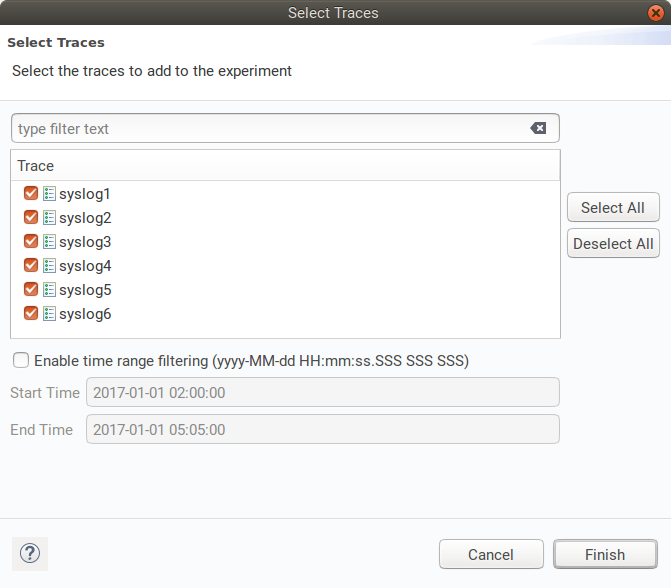
Time-based trace selection for experiments
It is now possible to activate time range filtering when selecting traces for an experiment. By using this option, only traces that are in or overlap the range will be added to the experiment.
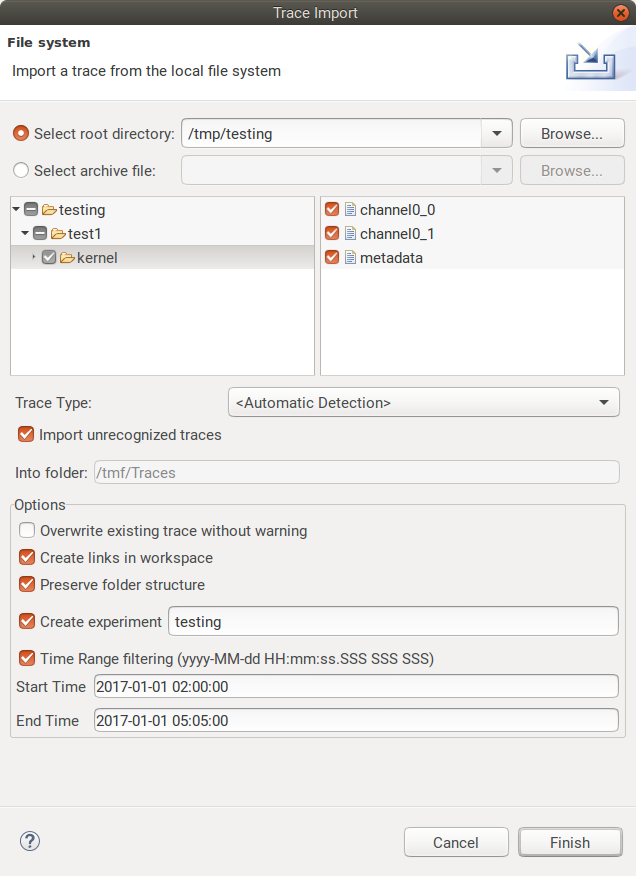
Time-based trace import
It is now possible to import traces using a time range filtering mechanism. When selected, this option gives the possibility to enter a time range in order to only import traces that are in or overlap the given range.
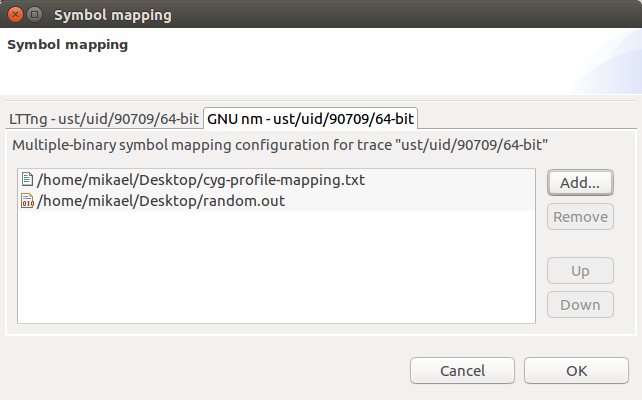
Multiple symbol mapper support
Multiple symbol provider can now be used to show missing data in a given trace. They UI is also streamlined.
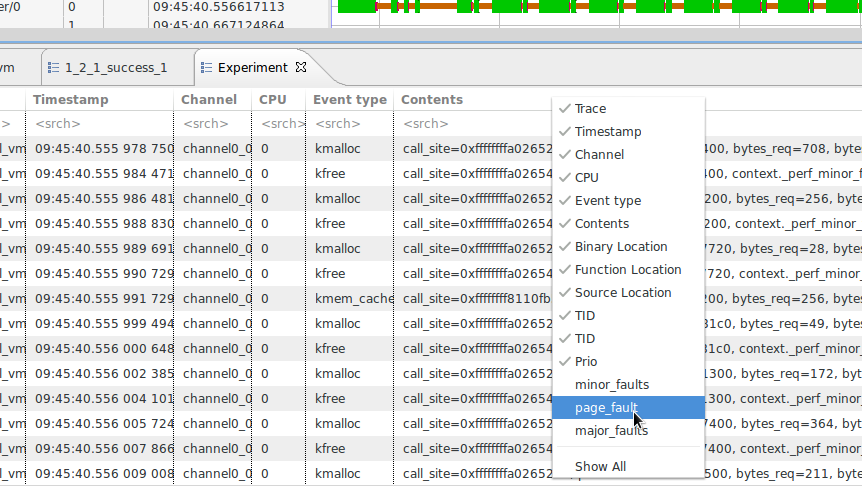
Linux Performance Counter Columns
Linux Performance Counters (AKA perf counters) are now available as aspects. These aspects are not displayed by default. To access them, right click on the events table header and select them. Columns containing the counters will them be visible in the events table.
Linux Performance Counter Visualization
A new view has been added to visualize Linux Performance counters from LTTng traces that have Perf counters added to the event context. The new Counters view provides a checkbox tree to select which counters to display in the chart beside.
Persist Expanded/Collapsed State Of Timegraph Entries
The expanded/collapsed state of timegraph entries is restored when switching back and forth between traces.
State System performance improvements
The State History Tree (data structure used for storing analysis results and persisting results on disk) has benefited from performance improvements: It takes less time to build it and it uses at least 2 times less space on disk. It's performance no longer degrades when multiple time series are stored (tread bombs for example). Moreover, values are indexed on their keys in addition to their times, which contributes to speeding up queries. Detailed performance benchmarks are visible at [1]
Virtual Time Graph Views
The time graph views are now virtualized, which means that only visible items are queried and rendered when navigating the view. This results in at least a 20% performance gain for most views. The Control Flow View and Resources View also benefit from new backend queries which make them even faster.
Bugs fixed in the 3.1.0 release
See Bugzilla report Bugs Fixed in Trace Compass 3.1.0


