Notice: this Wiki will be going read only early in 2024 and edits will no longer be possible. Please see: https://gitlab.eclipse.org/eclipsefdn/helpdesk/-/wikis/Wiki-shutdown-plan for the plan.
Difference between revisions of "Selector Performance Information"
| Line 3: | Line 3: | ||
After initial tests found this user profile call to be the biggest performance impact, some Jena query optimizations were completed and a new test round was conducted. The following graphs highlight the different before and after Jena optimization test results. | After initial tests found this user profile call to be the biggest performance impact, some Jena query optimizations were completed and a new test round was conducted. The following graphs highlight the different before and after Jena optimization test results. | ||
| − | [[Image: | + | [[Image:Selector_PerfImprovment1_Jan08.PNG]] |
| + | [[Image:Selector_perfImprovment2_Jan08.PNG]] | ||
The test numbers referenced in the above graphics are the response time for the specific calls defined as follows: | The test numbers referenced in the above graphics are the response time for the specific calls defined as follows: | ||
Revision as of 18:19, 27 January 2008
As part of the web-based Higgins deployment, performance tests were run for single user (with 2 information cards) to benchmark the performance parameters of the card selector. From these tests is was found that as part of the user profile operation there was a specific Jena based call, specifically: Jena based IdasBasedUserProfileService on RPPS component.
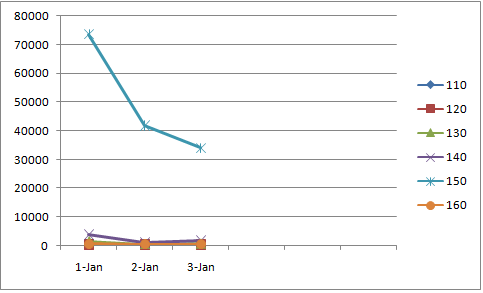
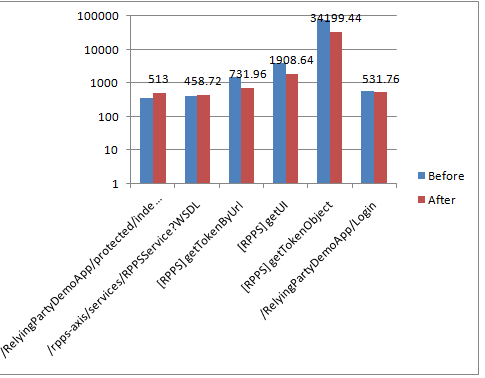
After initial tests found this user profile call to be the biggest performance impact, some Jena query optimizations were completed and a new test round was conducted. The following graphs highlight the different before and after Jena optimization test results.
The test numbers referenced in the above graphics are the response time for the specific calls defined as follows:
- The following 4 calls encompass the time it takes for the card selector window to pop up with the group of cards that match the RP claim requests:
- Test 110 - /RelyingPartyDemoApp/protected/index.jsp
- Test 120 - /rpps-axis/services/RPPSService?WSDL
- Test 130 - /[RPPS]getTokenByUrl
- Test 140 - /[RPPS]getUI
- The following 2 calls account for the time it takes for the login to the RP site once the user selects their login card and clicks "Next" on the selector
- Test 150 - /[RPPS]getTokenObject
- Test 160 - /RelyingPartyDemoApp/Login


