Notice: this Wiki will be going read only early in 2024 and edits will no longer be possible. Please see: https://gitlab.eclipse.org/eclipsefdn/helpdesk/-/wikis/Wiki-shutdown-plan for the plan.
PTP/System Monitoring FAQ
Contents
- 1 Q: What is PTP System Monitoring?
- 2 Q: What target systems are supported by PTP system monitoring?
- 3 Q: Where are references, links, and more design information on PTP System Monitoring?
- 4 Q: Where is system monitoring information stored on the remote target?
- 5 Q: How do I debug?
- 6 Q: How do I specify a custom layout file to determine how the frames, drawers, nodes, etc. are drawn on my remote target system?
Q: What is PTP System Monitoring?
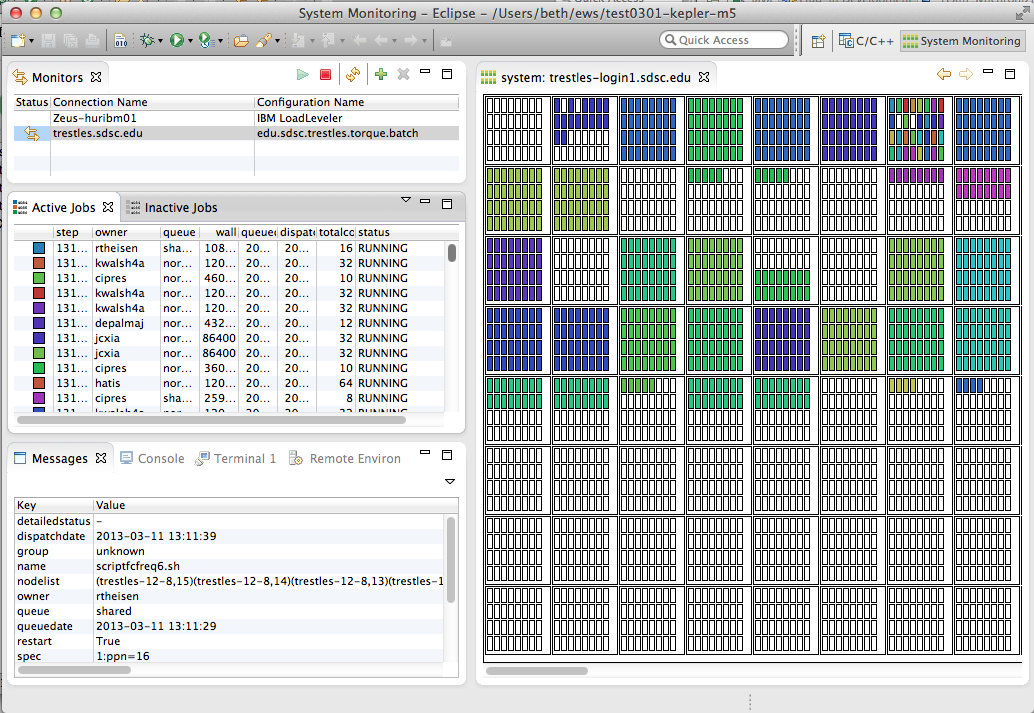
PTP System Monitoring is a perspective within the PTP workbench that allows display of jobs and their location on the target system. See the PTP online help section on monitoring. It is based on the LML (Large-scale system Markup Language) at Juelich Supercomputing Centre (need link).
PTP System Monitoring is also available as a stand-alone executable, PTP "SysMon", starting with Eclipse PTP Kepler release - PTP 7.0 (release scheduled for Jun 2013). For pre-release Kepler downloads including the SysMon executable, see the PTP Kepler download page. SysMon and the PTP System Monitoring Perspective of the full Eclipse PTP workbench (such as the Eclipse for Parallel Application Developers package on the Eclipse download page work essentially the same.
To start a monitor, in the System Monitoring Perspective (or in SysMon) create a new monitor in the upper-left 'Monitors' view. To refresh a monitor, select it and hit the refresh button. Monitors are refreshed automatically ever approx. 60 seconds.
Q: What target systems are supported by PTP system monitoring?
See Running programs in the PTP online help, which include a list of available target system configurations, some general, and some specific.
Q: Where are references, links, and more design information on PTP System Monitoring?
- Scalability and monitoring designs
- LML DA Driver - Architecture of the backend data collection engine
- LML - Description of the LML specification
- LML Schema - Schema for the LML protocol
- [https://bugs.eclipse.org/bugs/show_bug.cgi?id=403179 Bug 403179} has some sysmon info
Q: Where is system monitoring information stored on the remote target?
In the home directory of the userid used to connect with PTP, a directory ".eclipsesettings" is created when the monitor is created and started.
If you should need to reset a monitor to all default information, e.g. during debugging, you can safely delete this directory if needed and it will be recreated (with defaults) at the next monitor refresh.
Q: How do I debug?
In the ".eclipsesettings" directory, create a file named ".LML_da_options" and add a single line "keeptmp=1". Then refresh the monitor, or wait for it to refresh itself. On the target system, a new directory is created under .eclipsesettings that begins with "tmp". Information in this directory is useful to sysmon developers, so you may be asked to zip it up and send it. Be sure to remove the "keeptmp=1" line fro .LML_da_options, since it will continue to make a new dir at each monitor refresh.
Q: How do I specify a custom layout file to determine how the frames, drawers, nodes, etc. are drawn on my remote target system?
Layout files are in .eclipsesettings/samples directory. Need info about what's in this file.

