Notice: this Wiki will be going read only early in 2024 and edits will no longer be possible. Please see: https://gitlab.eclipse.org/eclipsefdn/helpdesk/-/wikis/Wiki-shutdown-plan for the plan.
Difference between revisions of "Linux Tools Project/GProf/User Guide"
(→Opening gmon.out) |
(No need to specify Xavier as the assignee) |
||
| Line 47: | Line 47: | ||
= Troubleshooting = | = Troubleshooting = | ||
| − | If you encounter a problem with gprof plugin, please [https://bugs.eclipse.org/bugs/enter_bug.cgi? | + | If you encounter a problem with the gprof plugin, please [https://bugs.eclipse.org/bugs/enter_bug.cgi?bug_severity=normal&bug_status=NEW&comment=&component=GProf&contenttypeentry=&contenttypemethod=autodetect&contenttypeselection=text%2Fplain&data=&dependson=&description=&flag_type-1=X&flag_type-2=X&flag_type-4=X&flag_type-6=X&flag_type-7=X&flag_type-8=X&form_name=enter_bug&keywords=&op_sys=Linux&priority=P3&product=Linux%20Tools&qa_contact=&rep_platform=PC&short_desc= file a bug]. |
Revision as of 15:01, 3 June 2011
{{#eclipseproject:technology.linux-distros}}
| Linux Tools | |
| Website | |
| Download | |
| Community | |
| Mailing List • Forums • IRC • mattermost | |
| Issues | |
| Open • Help Wanted • Bug Day | |
| Contribute | |
| Browse Source |
Overview
The Gprof plugin allows to visualize in eclipse gprof's output (aka gmon.out).
For more details on gprof, visit the GNU Gprof documentation at http://sourceware.org/binutils/docs-2.20/gprof/index.html .
Installation and Set-Up
Gprof plugin depends on binutils (such as addr2line, c++filt and nm). Gprof can be used on any platform as soon as these binutils are in PATH. For example, you can use it on windows with cygwin.
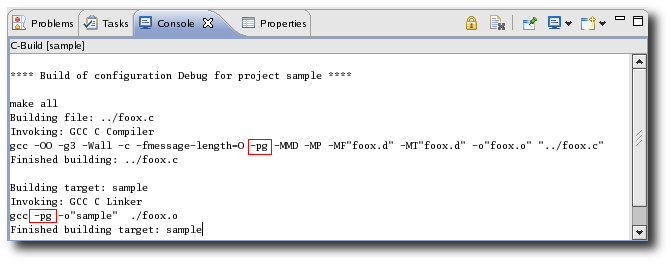
First of all, the user has to compile the C/C++ program with profiling enabled using the -pg option prior to running the tool.
Opening gmon.out
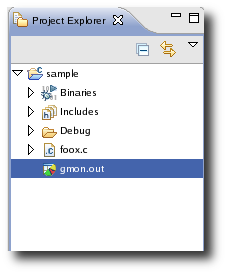
Once the application run is finished, a gmon.out file is generated under the project.
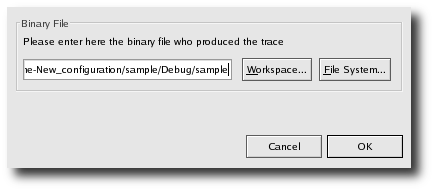
Double clicking on this file will open a dialog to select the associated binary.
GProf View
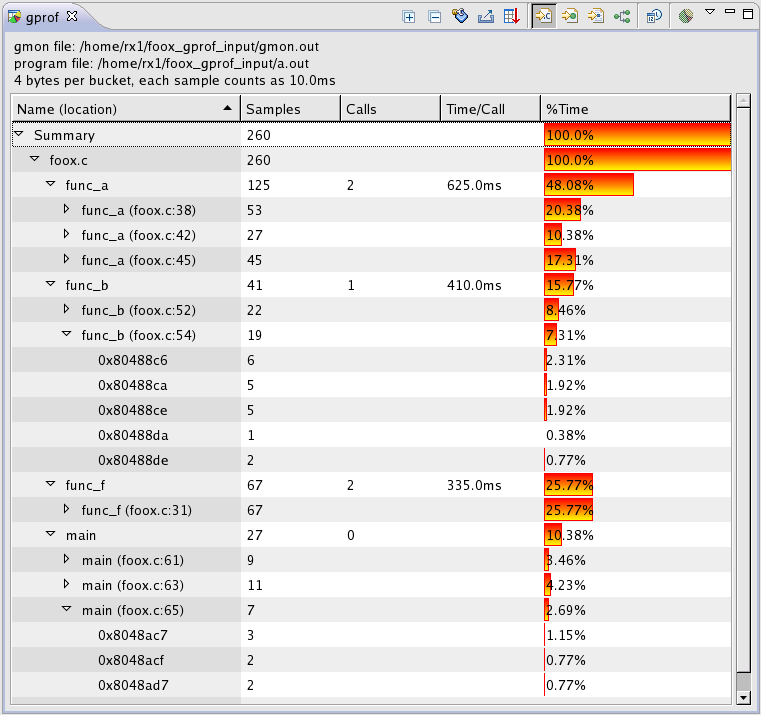
The Gprof view shows which parts of the program consume most of the execution time. It also provides call graph infomation for each function.
Several buttons are available in the toolbar.
-
 : "Export to CSV" button allows you to export the gprof result as a CSV text file, suitable for any spreadsheet.
 -
 : "Sort samples per file" button displays gprof result sorted by file.
 -
 : "Sort samples per function" button displays gprof result sorted by function.
 -
 : "Sort samples per line" button displays gprof result sorted by line.
 -
 : "Display function call graph" button displays gprof result as a call graph.
-
 : "Switch samples/time" button allows you to switch result display from samples to time and vice-versa.
 -
 : "Create Chart..." button allows you to create a BIRT chart, with the current lines selected in the gprof result view.
If program is compiled with debug option (e.g. "-g"), double-clicking on a item in the result will open the corresponding source location.
Troubleshooting
If you encounter a problem with the gprof plugin, please file a bug.


