Notice: this Wiki will be going read only early in 2024 and edits will no longer be possible. Please see: https://gitlab.eclipse.org/eclipsefdn/helpdesk/-/wikis/Wiki-shutdown-plan for the plan.
Difference between revisions of "JSDT/Debug/Rhino/Embedding Rhino Debugger"
(→Overview) |
m (JSDT/Debug/Embedding Rhino Debugger moved to JSDT/Debug/Rhino/Embedding Rhino Debugger: This page belongs to the Rhino group of pages and the page breadcrumb takes you up too many pages from the context) |
||
| (5 intermediate revisions by the same user not shown) | |||
| Line 11: | Line 11: | ||
The server-side requires a bit of configuration and some custom coding to get working as you want, but the client-side works the same way as Java remote debugging; such that you specify the address and port to connect to and start debugging. | The server-side requires a bit of configuration and some custom coding to get working as you want, but the client-side works the same way as Java remote debugging; such that you specify the address and port to connect to and start debugging. | ||
| − | == | + | == Setting up the Rhino Debugger == |
| − | == | + | === The Connection String === |
| − | == | + | When you want to create a new <code>RhinoDebugger</code> instance you must pass in a configuration string that is very similar to the remote debug string for Java. The string is composed of three sections: |
| + | ; transport : which defines how the debugger should communicate. Currently only <code>socket</code> is allowed | ||
| + | ; suspend : 'true' or 'y' if the debugger should start in suspended mode, such that execution will not continue until a client connects | ||
| + | ; address : the port number to open for the debugger to communicate on | ||
| + | |||
| + | An example of the debug string is as follows: | ||
| + | <pre> | ||
| + | transport=socket,suspend=y,address=9000 | ||
| + | </pre> | ||
| + | |||
| + | Used in code to create a new RhinoDebugger instance: | ||
| + | <source lang="java"> | ||
| + | RhinoDebugger debugger = new RhinoDebugger("transport=socket,suspend=y,address=9000"); | ||
| + | </source> | ||
| + | |||
| + | === Example Code === | ||
| + | The following is example code for creating a new <code>RhinoDebugger</code> instance and attaching it to a Rhino JavaScript context. | ||
| + | |||
| + | <source lang="java"> | ||
| + | ContextFactory factory = new ContextFactory(); | ||
| + | //see if the system property has been defined | ||
| + | String rhino = context.getProperty("rhino.debug"); | ||
| + | if(rhino == null) { | ||
| + | //if no system property, configure it manually | ||
| + | rhino = "transport=socket,suspend=y,address=9999"; | ||
| + | } | ||
| + | RhinoDebugger debugger = new RhinoDebugger(rhino); | ||
| + | debugger.start(); | ||
| + | factory.addListener(debugger); | ||
| + | </source> | ||
| + | |||
| + | == Connecting to a Remote Rhino Debugger == | ||
| + | |||
| + | To connect to a remote Rhino debugger is fairly straightforward. | ||
| + | |||
| + | The first step is to create a new Remote JavaScript launch configuration. To do so you must open the launch dialog in Debug mode, as the Remote JavaScript launch configuration does not apply to the Run mode. | ||
| + | |||
| + | With the dialog open, simply double-click the Remote JavaScript launch configuration to create a new one and fill in the required fields. | ||
| + | |||
| + | <gallery widths="340px" heights="260px" perrow="1"> | ||
| + | Image:Remote_js_config.png|The connect tab for a Remote JavaScript launch configuration | ||
| + | </gallery> | ||
| + | |||
| + | To connect to a remote Rhino debugger you will have to select '''Mozilla Rhino - Attaching Connector''' as the connector and fill in the host name and the port number of the host where the debugger is running. | ||
| + | |||
| + | == Testing Remote Rhino Locally == | ||
| + | |||
| + | To test remote Rhino debugging we have provided tools that let you more easily start the debugger and connect to it locally on the same machine. | ||
| + | |||
| + | You can start the Rhino debugger locally using the class <code>org.eclipse.wst.jsdt.debug.rhino.debugger.shell.DebugShell</code> from the <code>org.eclipse.jsdt.wst.debug.rhino.debugger</code> bundle. This class is basically a wrapper of the [https://developer.mozilla.org/en/Rhino_Shell Mozilla Rhino JavaScript Shell] that starts the interpreter in a server-like manner; it opens a port and communicates across it. | ||
| + | |||
| + | The easiest way to do this is to launch a Java Application launch configuration for the <code>DebugShell</code> class with some program arguments to open a given port, show tracing or not and start suspended or not. | ||
| + | |||
| + | The supported program arguments for <code>DebugShell</code> are: | ||
| + | |||
| + | ; -port <port_number>: value of the port number to open for the debugger to communicate on | ||
| + | ; -trace <'true' | 'y'>: if status should be reported to the Eclipse console | ||
| + | ; -suspend <'true' | 'y'>: if the debugger should start up in suspended mode, meaning it will not continue execution until a client connects to it | ||
| + | |||
| + | There are more debug arguments available that direct how the Rhino interpreter will behave. Those arguments are from the [https://developer.mozilla.org/en/Rhino_Shell Mozilla Rhino page] in the '''Invoking the Shell''' section. | ||
| + | |||
| + | Once you launch the configuration, and if tracing is enabled using the <code>-trace</code> argument, you should see output similar to the following in the Eclipse console: | ||
| + | <pre> | ||
| + | Rhino debugger | ||
| + | Start at time: January 10, 2011 8:29:34 CST PM | ||
| + | Listening to socket on port: 9000 | ||
| + | Started suspended - waiting for client resume... | ||
| + | </pre> | ||
| + | |||
| + | Now that the Rhino debugger is up and running you can connect to it using the instruction from the previous section on connecting to the debugger. | ||
| + | |||
| + | After the client is connected you will want to load scripts into the Rhino interpreter and debug them. Loading scripts can be done from the Eclipse console using the commands directly from the [https://developer.mozilla.org/en/Rhino_Shell Mozilla Rhino page] in the '''Predefined Properties''' section. | ||
| + | |||
| + | == Tips and Tricks == | ||
| + | When using the Remote Rhino debugger it is always a good idea to have a few of the client settings enabled. These settings can be found on the '''JavaScript > Debug''' preference page or in the Launch view menu. | ||
| + | |||
| + | The settings in question are: | ||
| + | *Suspend for all script loads - which will cause the debugger and client to suspend for '''all''' scripts that are loaded into the Rhino interpreter | ||
| + | *Suspend on JavaScript exceptions - which will suspend when a JavaScript exception occurs | ||
Latest revision as of 21:41, 14 January 2011
| JSDT Debug | |
| Website | |
| Download | |
| Community | |
| Mailing List • Forums • IRC • mattermost | |
| Issues | |
| Open • Help Wanted • Bug Day | |
| Contribute | |
| Browse Source • Project Set File |
Contents
Overview
This page describes how you can take advantage of the remote Rhino debug support from both the client and server side. It provides in-depth details on how to set up Rhino debugging in your server and how you can connect to a server already running the Rhino debugger.
There are two pieces to make this work:
- the server-side bits
org.eclipse.wst.jsdt.debug.rhino.debuggerandorg.eclipse.wst.jsdt.debug.transportthat are used to load scripts to be debugged, and - the client-side bits which is the Eclipse integration and UI
The server-side requires a bit of configuration and some custom coding to get working as you want, but the client-side works the same way as Java remote debugging; such that you specify the address and port to connect to and start debugging.
Setting up the Rhino Debugger
The Connection String
When you want to create a new RhinoDebugger instance you must pass in a configuration string that is very similar to the remote debug string for Java. The string is composed of three sections:
- transport
- which defines how the debugger should communicate. Currently only
socketis allowed - suspend
- 'true' or 'y' if the debugger should start in suspended mode, such that execution will not continue until a client connects
- address
- the port number to open for the debugger to communicate on
An example of the debug string is as follows:
transport=socket,suspend=y,address=9000
Used in code to create a new RhinoDebugger instance:
RhinoDebugger debugger = new RhinoDebugger("transport=socket,suspend=y,address=9000");
Example Code
The following is example code for creating a new RhinoDebugger instance and attaching it to a Rhino JavaScript context.
ContextFactory factory = new ContextFactory();
//see if the system property has been defined
String rhino = context.getProperty("rhino.debug");
if(rhino == null) {
  //if no system property, configure it manually
  rhino = "transport=socket,suspend=y,address=9999";
}
RhinoDebugger debugger = new RhinoDebugger(rhino);
debugger.start();
factory.addListener(debugger);
Connecting to a Remote Rhino Debugger
To connect to a remote Rhino debugger is fairly straightforward.
The first step is to create a new Remote JavaScript launch configuration. To do so you must open the launch dialog in Debug mode, as the Remote JavaScript launch configuration does not apply to the Run mode.
With the dialog open, simply double-click the Remote JavaScript launch configuration to create a new one and fill in the required fields.
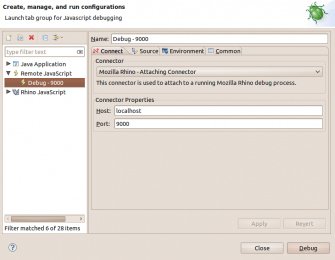
The connect tab for a Remote JavaScript launch configuration

To connect to a remote Rhino debugger you will have to select Mozilla Rhino - Attaching Connector as the connector and fill in the host name and the port number of the host where the debugger is running.
Testing Remote Rhino Locally
To test remote Rhino debugging we have provided tools that let you more easily start the debugger and connect to it locally on the same machine.
You can start the Rhino debugger locally using the class org.eclipse.wst.jsdt.debug.rhino.debugger.shell.DebugShell from the org.eclipse.jsdt.wst.debug.rhino.debugger bundle. This class is basically a wrapper of the Mozilla Rhino JavaScript Shell that starts the interpreter in a server-like manner; it opens a port and communicates across it.
The easiest way to do this is to launch a Java Application launch configuration for the DebugShell class with some program arguments to open a given port, show tracing or not and start suspended or not.
The supported program arguments for DebugShell are:
- -port <port_number>
- value of the port number to open for the debugger to communicate on
- -trace <'true' | 'y'>
- if status should be reported to the Eclipse console
- -suspend <'true' | 'y'>
- if the debugger should start up in suspended mode, meaning it will not continue execution until a client connects to it
There are more debug arguments available that direct how the Rhino interpreter will behave. Those arguments are from the Mozilla Rhino page in the Invoking the Shell section.
Once you launch the configuration, and if tracing is enabled using the -trace argument, you should see output similar to the following in the Eclipse console:
Rhino debugger
Start at time: January 10, 2011 8:29:34 CST PM
Listening to socket on port: 9000
Started suspended - waiting for client resume...
Now that the Rhino debugger is up and running you can connect to it using the instruction from the previous section on connecting to the debugger.
After the client is connected you will want to load scripts into the Rhino interpreter and debug them. Loading scripts can be done from the Eclipse console using the commands directly from the Mozilla Rhino page in the Predefined Properties section.
Tips and Tricks
When using the Remote Rhino debugger it is always a good idea to have a few of the client settings enabled. These settings can be found on the JavaScript > Debug preference page or in the Launch view menu.
The settings in question are:
- Suspend for all script loads - which will cause the debugger and client to suspend for all scripts that are loaded into the Rhino interpreter
- Suspend on JavaScript exceptions - which will suspend when a JavaScript exception occurs