Notice: this Wiki will be going read only early in 2024 and edits will no longer be possible. Please see: https://gitlab.eclipse.org/eclipsefdn/helpdesk/-/wikis/Wiki-shutdown-plan for the plan.
Difference between revisions of "Execution Analysis"
(→Execution Analysis : Identify a bottleneck) |
(→Execution Analysis : Identify a bottleneck) |
||
| Line 15: | Line 15: | ||
------------- | ------------- | ||
Return to the [[Profiling with TPTP - plug-in developmeet]] page. | Return to the [[Profiling with TPTP - plug-in developmeet]] page. | ||
| + | Return to the [[TPTP]] wiki Page | ||
Revision as of 09:35, 8 October 2008
Execution Analysis : Identify a bottleneck
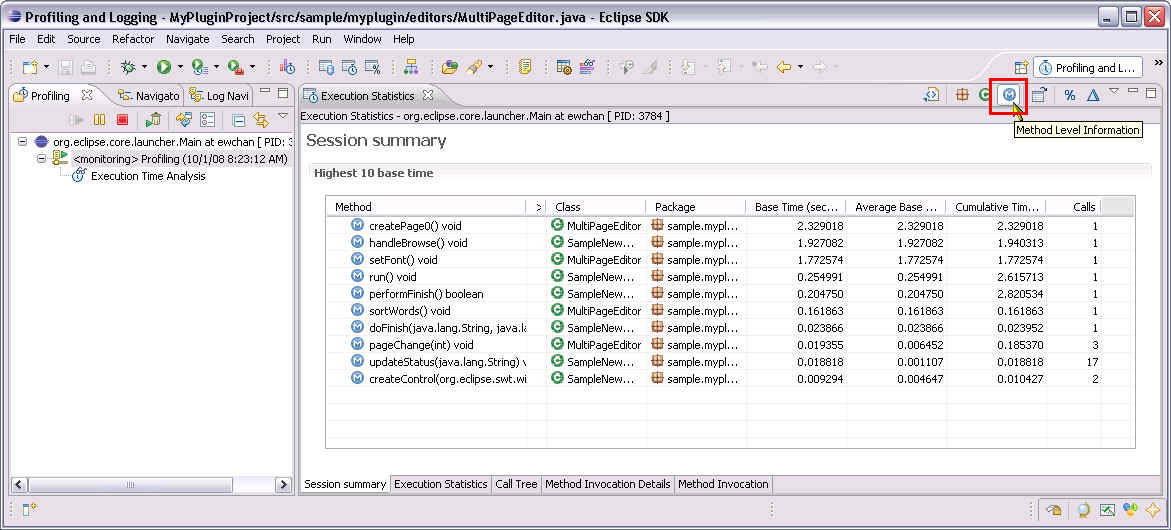
Execution Statistics view provides several approaches to identify a potential bottleneck in an application run. By changing the view to Method level Information orientation, list of methods is shown in the table.
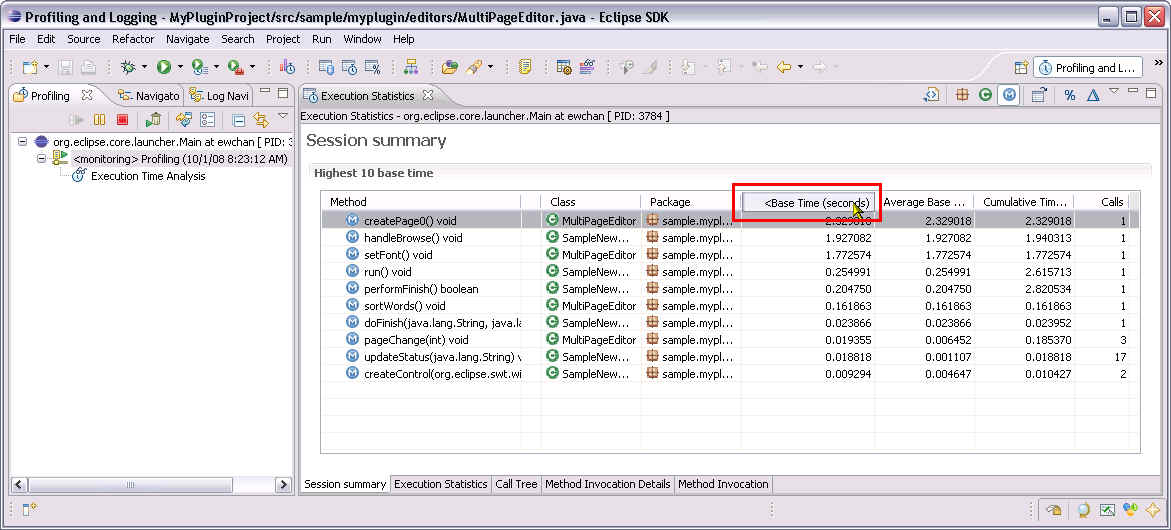
Sort the table with Base Time column, the method with most time spend will be shown as top of the list.
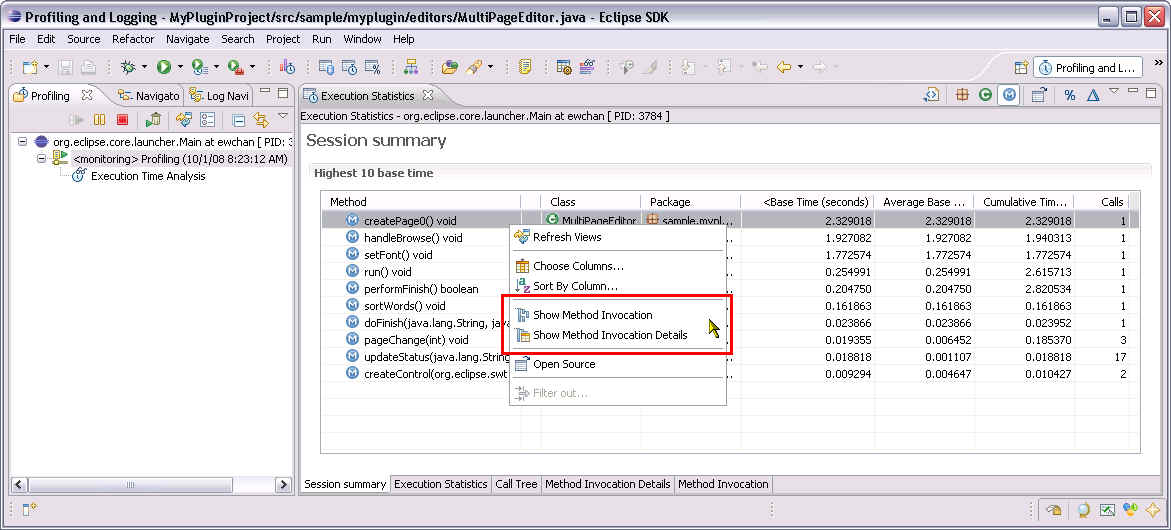
Further investigation can be done by opening the Method Invocation views. They shows invocation detail about the methods like the callee and caller of the method in selection.
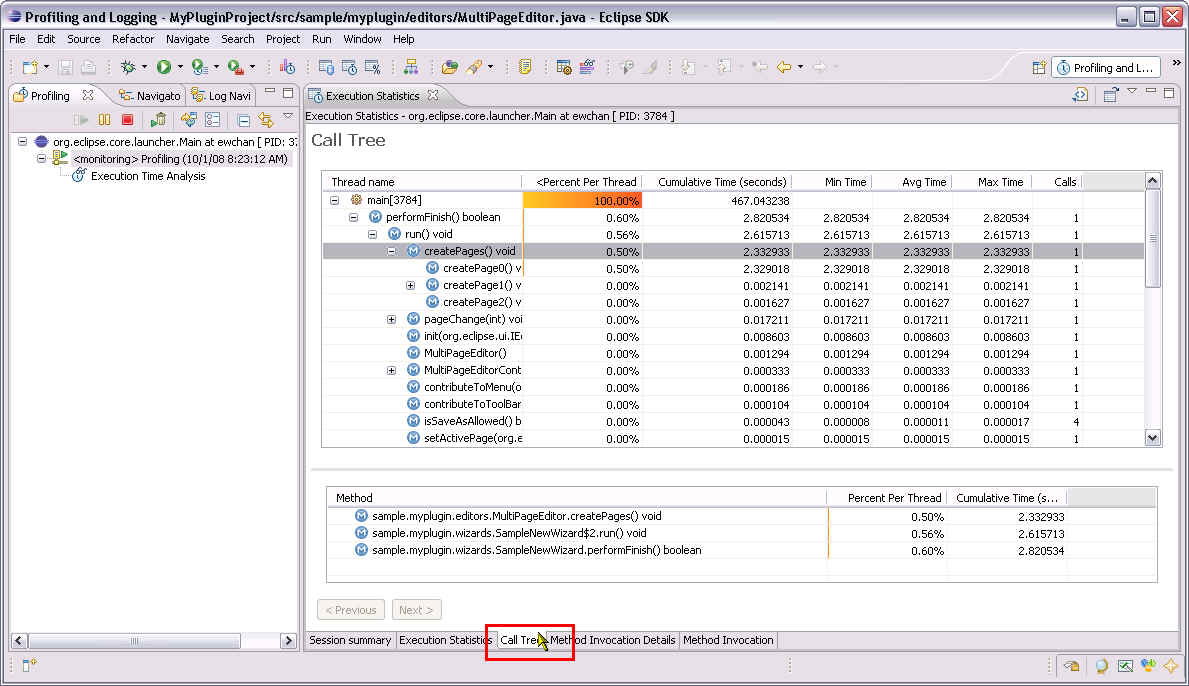
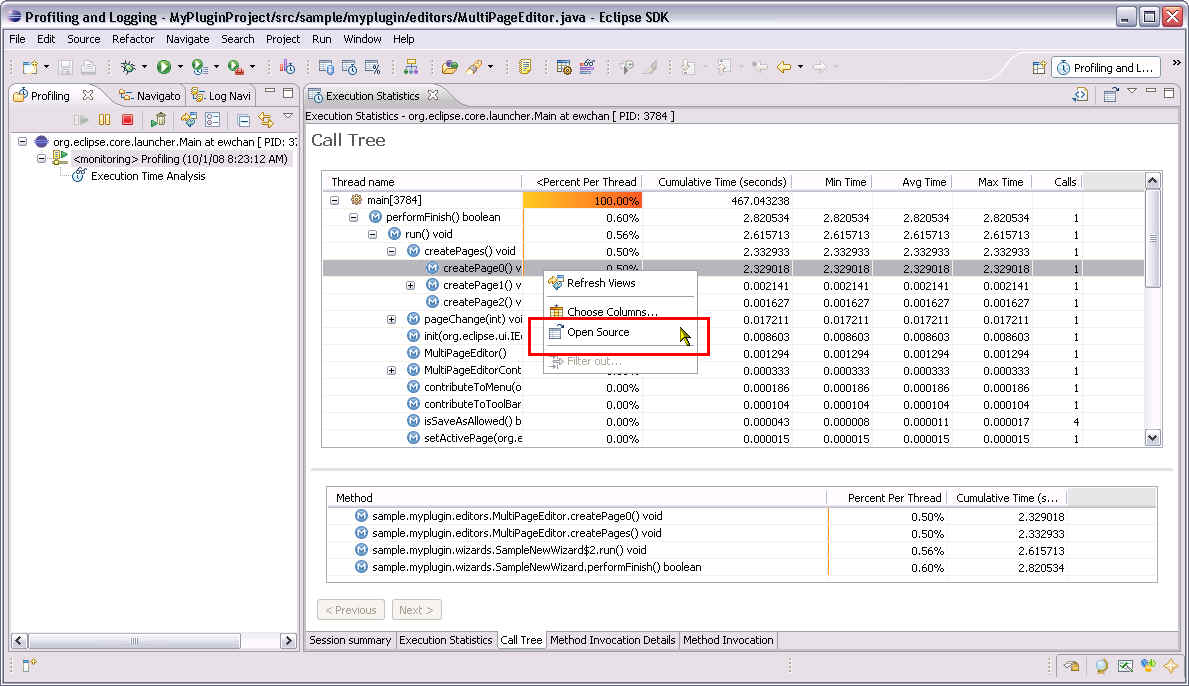
Alternatively, Call tree tab is useful to quickly identify the bottleneck of an application run by inspecting the highest percentage of time spend in each thread of the application.
Once a potential bottleneck is identified, Open Source action in context menu is a quick way to navigate to the source code for further investigation of problem.
Return to the Profiling with TPTP - plug-in developmeet page. Return to the TPTP wiki Page

