Notice: this Wiki will be going read only early in 2024 and edits will no longer be possible. Please see: https://gitlab.eclipse.org/eclipsefdn/helpdesk/-/wikis/Wiki-shutdown-plan for the plan.
Difference between revisions of "BaSyx / Documentation / Monitoring Scenarios"
(→Node Red) |
(→Overview) |
||
| Line 1: | Line 1: | ||
== Overview == | == Overview == | ||
| − | + | Basyx enables integration with third-party tools to support real-time data visualization, real-time data monitoring, and data processing. | |
| − | + | The following examples provide different use cases according each tool and application. | |
== Applications & Benefits == | == Applications & Benefits == | ||
Revision as of 06:20, 17 November 2020
Contents
Overview
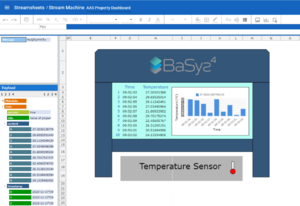
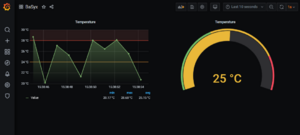
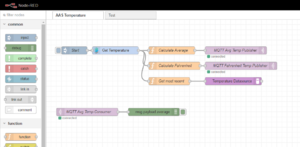
Basyx enables integration with third-party tools to support real-time data visualization, real-time data monitoring, and data processing. The following examples provide different use cases according each tool and application.
Applications & Benefits
Streamsheets
Grafana
Node Red
How to Use
TODO: deploy the built docker images to DockerHub TODO: Push the files to BaSyx SDK
A full example for monitoring properties in Asset Administration Shells is given in the Git repository. To run this example, there exist following minimum requirements:
- Git
- A running Docker environment
To download the necessary files, you can check out the BaSyx repository from the command line with:
git clone https://git.eclipse.org/r/basyx/basyx
After checking out the repository, you can easily run the example:
1. Browse to /examples/monitoring
2. Run the "start.bat"-file or alternatively run "docker-compose up" in the /docker folder
If there are issues with the docker environment, make sure that the files inside of the git repository are shared with the docker containers by configuring the file sharing mechanism in the docker daemon settings.


