Notice: this Wiki will be going read only early in 2024 and edits will no longer be possible. Please see: https://gitlab.eclipse.org/eclipsefdn/helpdesk/-/wikis/Wiki-shutdown-plan for the plan.
Difference between revisions of "Analyzing ICE with SonarQube"
(→Creating the Run Configuration) |
m |
||
| (18 intermediate revisions by the same user not shown) | |||
| Line 1: | Line 1: | ||
| + | '''This article is out of date for the 'next' branch. The new build structure does not currently contain a SonarQube build.''' | ||
| + | |||
After completing the steps in the [[ICE Build Instructions]], an additional Maven build may be executed to analyze the quality of the ICE source code using SonarQube. The development team recommends that the build be executed in Eclipse. | After completing the steps in the [[ICE Build Instructions]], an additional Maven build may be executed to analyze the quality of the ICE source code using SonarQube. The development team recommends that the build be executed in Eclipse. | ||
== Create the Run Configuration == | == Create the Run Configuration == | ||
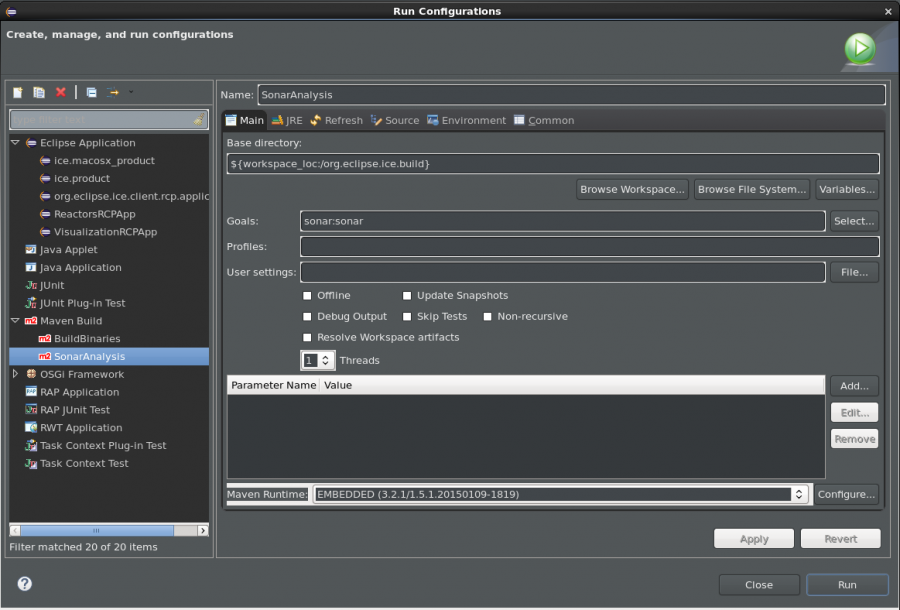
| − | To create a custom run configuration to analyze all of the ICE source code, select ''Run > Run Configurations...'' from the menu bar. Alternatively | + | To create a custom run configuration to analyze all of the ICE source code, select ''Run > Run Configurations...'' from the menu bar. Alternatively, right-click on the <tt>pom.xml</tt> file in the top-level ICE directory in the Package Explorer, and select ''Run As > Run Configurations...'' from the context menu. In the ''Run Configurations'' dialog that appears, select ''Maven Build'' from the list on the left, and click the ''New launch configuration'' button near the top of this pane. Provide a name for the new configuration. Set the base directory to the org.eclipse.ice.aggregator directory. In the ''Goals:'' text field, enter sonar:sonar. Next to the parameter table in the dialog, click ''Add...''. The dialog that appears allows you to set the names and values of parameters that appear in the <tt>pom.xml</tt> file. Unfortunately, we cannot widely distribute the values for these parameters, but if you need them, please send a request to <code>eclipse.ice.project <at> gmail.com</code>. After entering the parameters in the table, click ''Apply'' and then click ''Run''. |
| + | |||
| + | [[File:ICESonarRunConf.png|center|900px]] | ||
== View the Analysis Results == | == View the Analysis Results == | ||
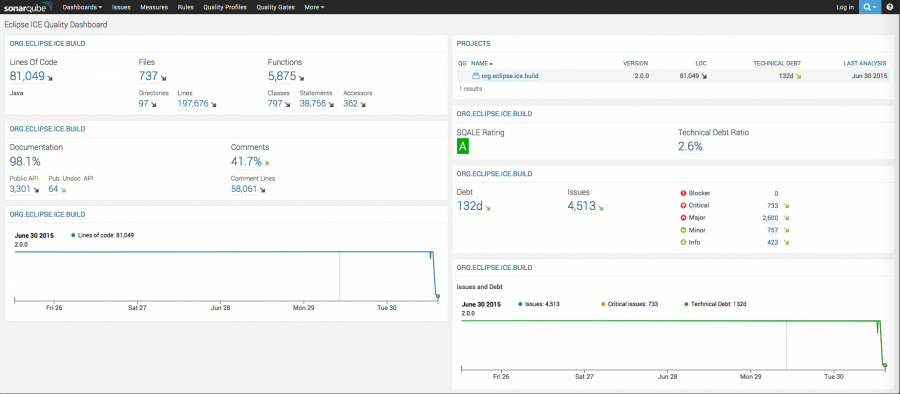
Following a successful execution of the run configuration, the full analysis results may be viewed in a web browser by visiting the URL provided by the development team. | Following a successful execution of the run configuration, the full analysis results may be viewed in a web browser by visiting the URL provided by the development team. | ||
| + | |||
| + | [[File:ICESonarWebFull.png|center|900px]] | ||
== Install SonarQube for Eclipse == | == Install SonarQube for Eclipse == | ||
| Line 13: | Line 19: | ||
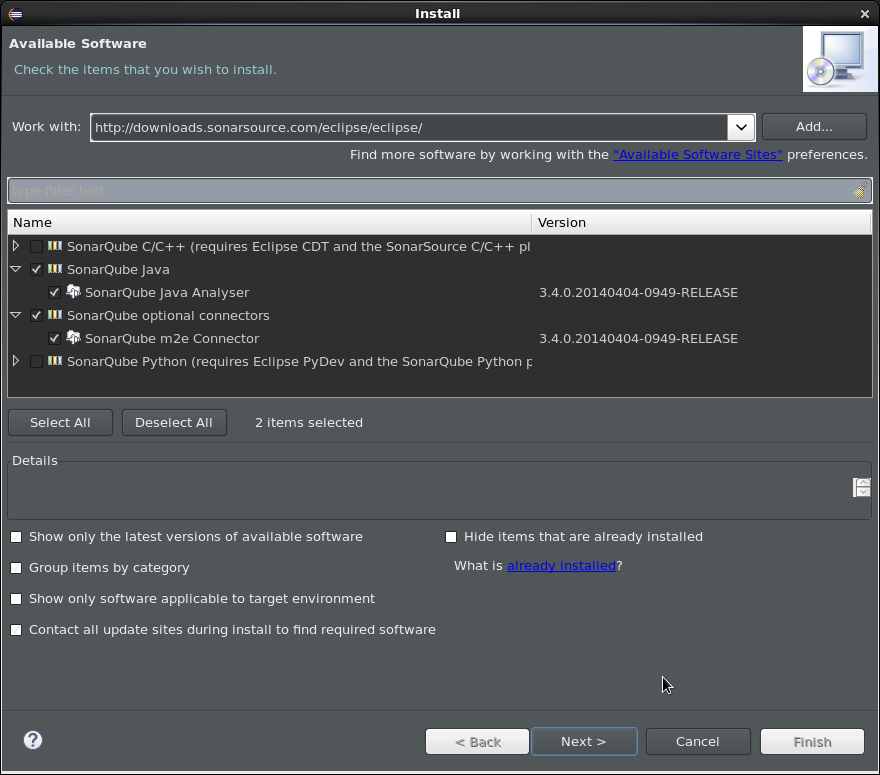
The SonarQube C/C++ and Python Analyzers may be excluded for analyzing ICE’s source code, but the Java Analyzer and m2e Connector are required. | The SonarQube C/C++ and Python Analyzers may be excluded for analyzing ICE’s source code, but the Java Analyzer and m2e Connector are required. | ||
| + | |||
| + | [[File:ICESonarInstall.png|900px]] | ||
=== Set the SonarQube Server === | === Set the SonarQube Server === | ||
After installing the software, the SonarQube web server URL must be set in the Eclipse workspace preferences by selecting ''Window > Preferences'' from the menu bar. Expand SonarQube from the list on the left of the dialog, and select Servers. Edit the server address to the URL provided by the development team. | After installing the software, the SonarQube web server URL must be set in the Eclipse workspace preferences by selecting ''Window > Preferences'' from the menu bar. Expand SonarQube from the list on the left of the dialog, and select Servers. Edit the server address to the URL provided by the development team. | ||
| + | === View Single Bundle Results === | ||
The results for a single bundle may be reviewed within Eclipse. To do this, right-click the bundle to review. Mouse over ''Configure'', and select ''Associate with SonarQube''. If a full analysis has been completed previously, the results on the server should be detected automatically, and clicking ''Finish'' is all that is required in the dialog that is displayed. | The results for a single bundle may be reviewed within Eclipse. To do this, right-click the bundle to review. Mouse over ''Configure'', and select ''Associate with SonarQube''. If a full analysis has been completed previously, the results on the server should be detected automatically, and clicking ''Finish'' is all that is required in the dialog that is displayed. | ||
| − | + | '''SonarQube Issues View'''<br> | |
| + | The previous step may open the SonarQube Issues view. If this view is not opened automatically, right-click the bundle again, mouse over ''SonarQube'', and select ''Analyze''. This view provides a collapsible list of all of the quality issues detected by SonarQube. | ||
| + | |||
| + | [[File:ICESonarIssuesView.png|900px]] | ||
| + | |||
| + | '''SonarQube Web Browser View'''<br> | ||
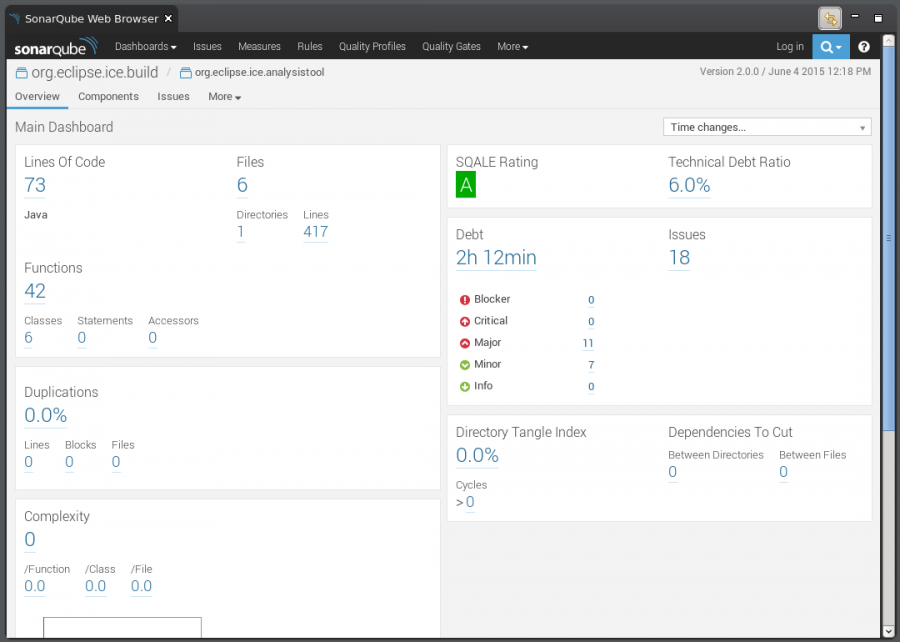
| + | To view the SonarQube results for a single bundle in a manner similar to the view available in the web browser version, right-click the bundle to be viewed, mouse over ''SonarQube'' in the context menu, and select ''Open in SonarQube Server''. | ||
| + | |||
| + | [[File:ICESonarWebBrowser.png|900px]] | ||
| + | |||
| + | '''Editor Flags'''<br> | ||
| + | Finally, SonarQube issues can be viewed inline with the offending code directly in the editor window. SonarQube issues are marked in the gutter of the editor with the following icon: | ||
| + | |||
| + | [[File:ICESonarFlag.png]] | ||
Latest revision as of 17:30, 24 February 2016
This article is out of date for the 'next' branch. The new build structure does not currently contain a SonarQube build.
After completing the steps in the ICE Build Instructions, an additional Maven build may be executed to analyze the quality of the ICE source code using SonarQube. The development team recommends that the build be executed in Eclipse.
Contents
Create the Run Configuration
To create a custom run configuration to analyze all of the ICE source code, select Run > Run Configurations... from the menu bar. Alternatively, right-click on the pom.xml file in the top-level ICE directory in the Package Explorer, and select Run As > Run Configurations... from the context menu. In the Run Configurations dialog that appears, select Maven Build from the list on the left, and click the New launch configuration button near the top of this pane. Provide a name for the new configuration. Set the base directory to the org.eclipse.ice.aggregator directory. In the Goals: text field, enter sonar:sonar. Next to the parameter table in the dialog, click Add.... The dialog that appears allows you to set the names and values of parameters that appear in the pom.xml file. Unfortunately, we cannot widely distribute the values for these parameters, but if you need them, please send a request to eclipse.ice.project <at> gmail.com. After entering the parameters in the table, click Apply and then click Run.
View the Analysis Results
Following a successful execution of the run configuration, the full analysis results may be viewed in a web browser by visiting the URL provided by the development team.
Install SonarQube for Eclipse
Optionally, the SonarQube for Eclipse software may be installed in your workspace in order to view analysis results directly in Eclipse. This software may be installed using the Eclipse Marketplace or via Help > Install New Software... using the following site:
http://downloads.sonarsource.com/eclipse/eclipse/
The SonarQube C/C++ and Python Analyzers may be excluded for analyzing ICE’s source code, but the Java Analyzer and m2e Connector are required.
Set the SonarQube Server
After installing the software, the SonarQube web server URL must be set in the Eclipse workspace preferences by selecting Window > Preferences from the menu bar. Expand SonarQube from the list on the left of the dialog, and select Servers. Edit the server address to the URL provided by the development team.
View Single Bundle Results
The results for a single bundle may be reviewed within Eclipse. To do this, right-click the bundle to review. Mouse over Configure, and select Associate with SonarQube. If a full analysis has been completed previously, the results on the server should be detected automatically, and clicking Finish is all that is required in the dialog that is displayed.
SonarQube Issues View
The previous step may open the SonarQube Issues view. If this view is not opened automatically, right-click the bundle again, mouse over SonarQube, and select Analyze. This view provides a collapsible list of all of the quality issues detected by SonarQube.
SonarQube Web Browser View
To view the SonarQube results for a single bundle in a manner similar to the view available in the web browser version, right-click the bundle to be viewed, mouse over SonarQube in the context menu, and select Open in SonarQube Server.
Editor Flags
Finally, SonarQube issues can be viewed inline with the offending code directly in the editor window. SonarQube issues are marked in the gutter of the editor with the following icon:


