Notice: This Wiki is now read only and edits are no longer possible. Please see: https://gitlab.eclipse.org/eclipsefdn/helpdesk/-/wikis/Wiki-shutdown-plan for the plan.
Memory Analysis
Memory Analysis : Identify a memory leak
Memory leak problem can be identify with the help of Memory Analysis. Memory Analysis can be enabled in the
launch configuration by selecting Memory Analysis type of a Java profiler.
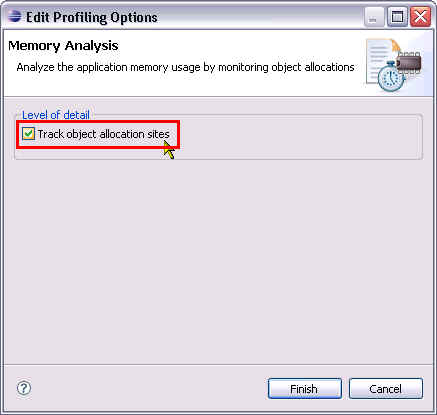
If allocation detail information is required, enable the Track Object Allocation Site option in the
Edit Option detail of the analysis type.
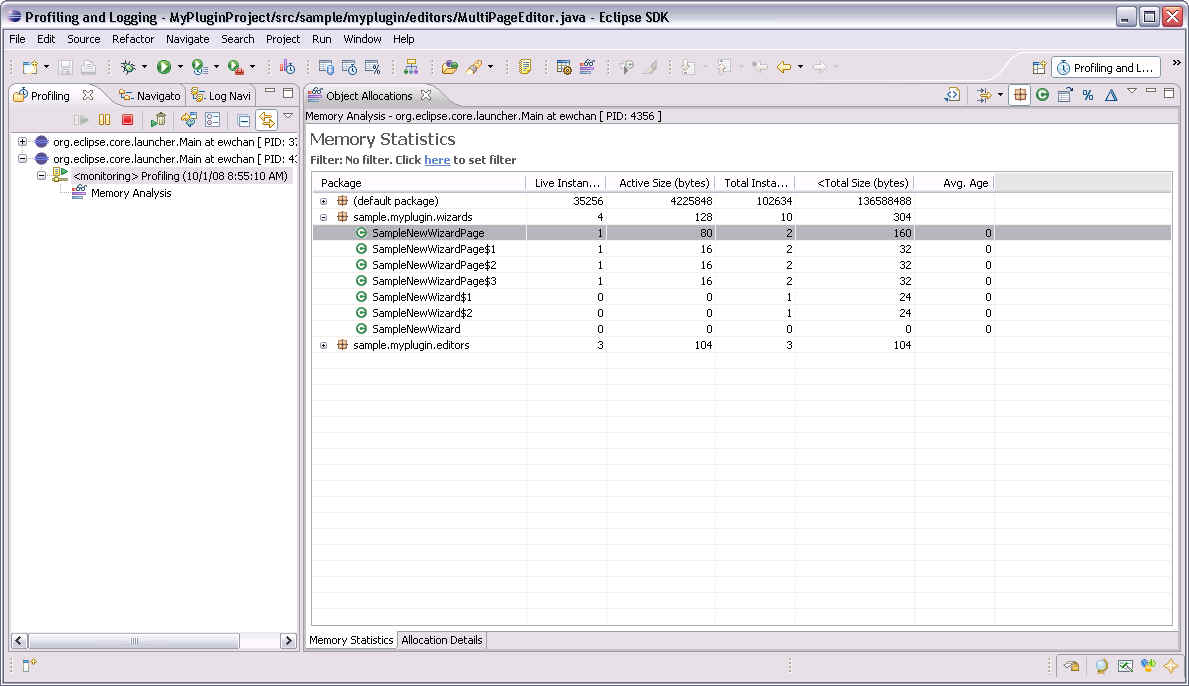
Double-clicking on the profile agent opens the Memory Statistics view which shows memory related
information of an application under profiled.
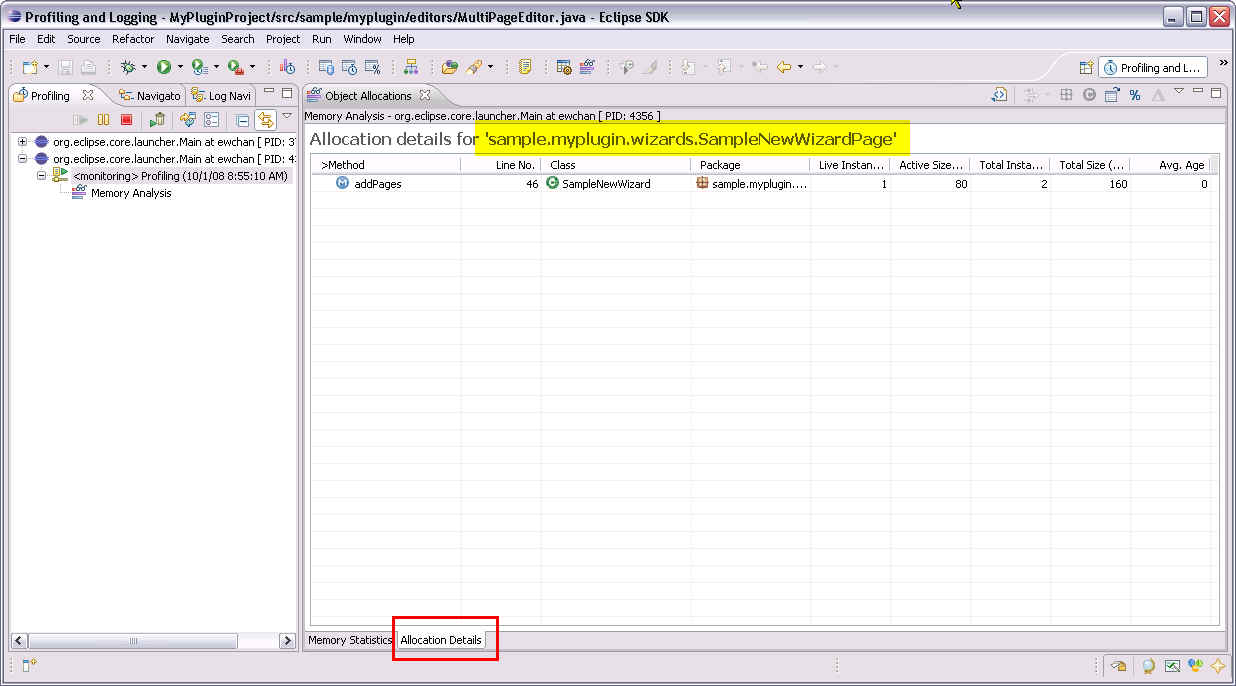
Selecting any class instance in the table and switch to the Allocation Details tab gives more
information about the allocation of the selected class. Note that allocation details is available only when
Track Object Allocation Site option is enabled in the profile configuration.
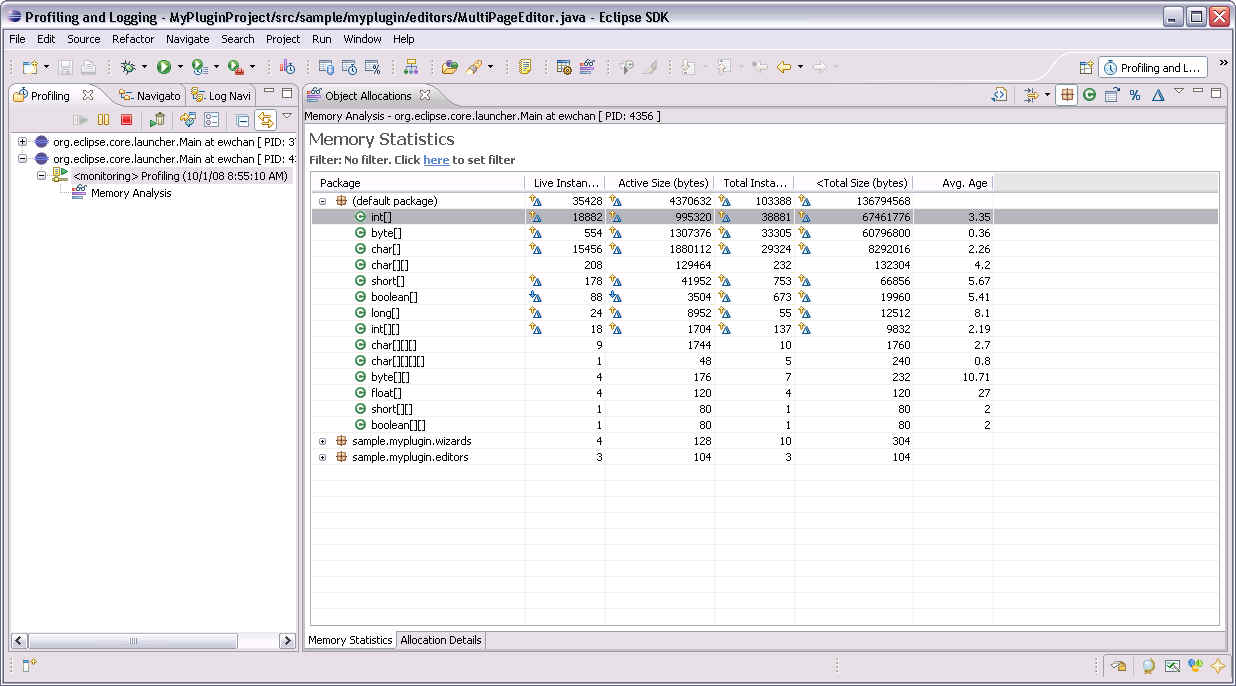
In the view, array information is also traced. They are shown as type[] for array or type[][] for two-
dimensional array and so on.
Return to the Profiling with TPTP - plug-in developmeet page.


