Notice: This Wiki is now read only and edits are no longer possible. Please see: https://gitlab.eclipse.org/eclipsefdn/helpdesk/-/wikis/Wiki-shutdown-plan for the plan.
Linux Tools Project/Valgrind/User Guide
Contents
Overview
Valgrind is an instrumentation framework for building dynamic analysis tools used to profile applications in detail. Valgrind tools are generally used to automatically detect many memory management and threading problems. The Valgrind suite also includes tools that allow you to build new profiling tools to suit your profiling needs.
The Valgrind plug-in for Eclipse (documented herein) integrates several Valgrind tools into Eclipse. This allows Eclipse users to seamlessly include profiling capabilities into their workflow. At present, the Valgrind plug-in for Eclipse supports three Valgrind tools: Memcheck, Massif, and Cachegrind.
For more information about Valgrind, refer to http://www.valgrind.org/.
Installing
In order for the Valgrind plug-in for Eclipse to work properly, you should have Valgrind 3.3.0 (or later) installed on your system first.
The easiest way to install the Valgrind plug-in for Eclipse is through the Software Updates and Add-ons menu. For information on how to use this menu, refer to [this link].
General Usage
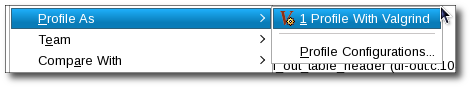
- The launch shortcut can create a configuration with default options for your program.
- Same as running
valgrind ./myprogfrom the command line. - After a configuration has already been created, the launch shortcut will launch your most recently used configuration.
- Same as running
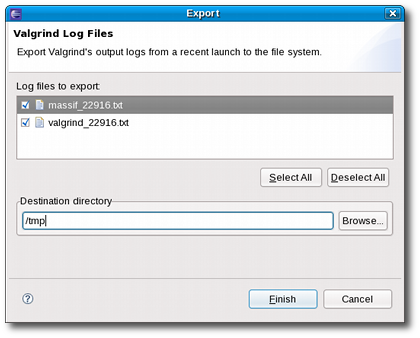
- If you wish to export the raw data Valgrind collects, an export wizard is available from either File->Export... or through the shortcut in the Valgrind view's toolbar.


Using Memcheck
- Memcheck discovers memory management problems in your program. (http://www.valgrind.org/docs/manual/mc-manual.html)
- It is the default tool.
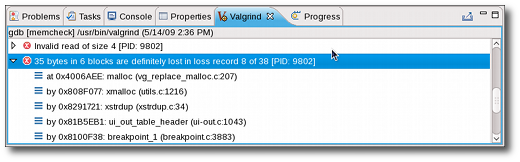
- Any memory management errors reported by Valgrind are listed in the Valgrind view, which should appear automatically.
- Each error has a stack trace.
- If the source can be resolved, double-clicking on the stack frame will open an editor to its line.
- View and modify your profile configuration by selecting "Profile Configurations".
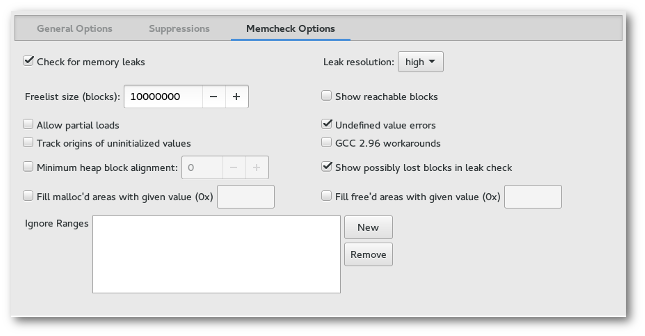
- All Valgrind related configuration options can be changed from the Valgrind Options tab.
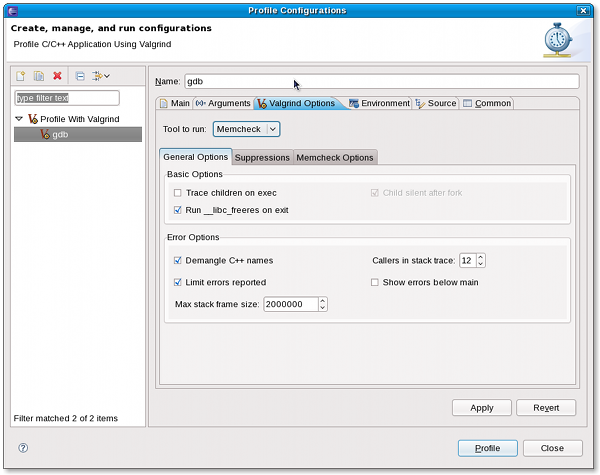
- General options and Suppressions are Valgrind core options and are not dependent on the tool being run.
- Details on Memcheck suppressions can be found here.
- Specific Memcheck options can also be configured.
- All Valgrind related configuration options can be changed from the Valgrind Options tab.


Using Massif
- Massif is heap profiling tool that details memory usage throughout your program's execution. (http://www.valgrind.org/docs/manual/ms-manual.html)
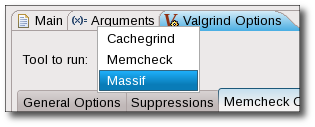
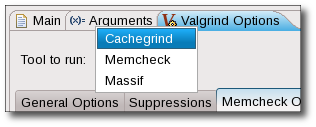
- To use Massif, you need to switch the tool in your profile configuration.
- Massif has a lot of output to distil. There are 3 ways to view the data.
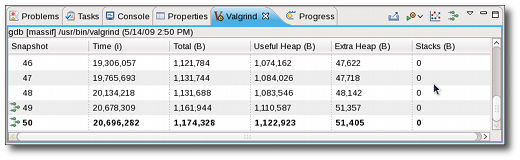
- Massif outputs statistics for each unit of time (default: instructions) in the application. These are called "snapshots" of your program.
- The Valgrind view initially displays each snapshot in a table showing heap allocation statistics.
- Some snapshots are detailed (denoted by
 ) and have a function call trace corresponding to contribution heap allocations.
 - The peak snapshot is in bold text.
- Some snapshots are detailed (denoted by
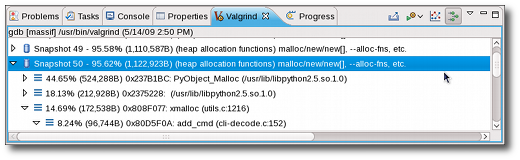
- Detailed snapshots can be inspected by double-clicking on them in the snapshot table.
- Each detailed snapshot is shown in a tree structure that forms a hierarchy of function calls accounting for that snapshot's allocations.
- Double clicking on any function with a source file listed will attempt to open an editor to it.
- Toggle between the snapshot table and detailed snapshot tree with the "Show Heap Tree" button in the view's toolbar.
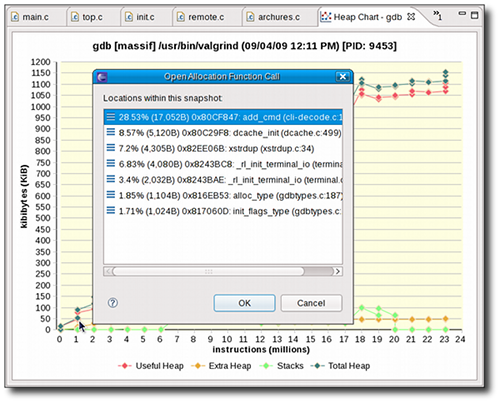
- The data presented in the snapshot table is also shown in line chart form.
- Clicking on any data point selects it in the snapshot table.
- Double-clicking on any data point that corresponds to a detailed snapshot will open an editor to one of its function calls.
- The top-most function calls in the trace that contain source files are presented as choices if more than one exists.
- The top-most function calls in the trace that contain source files are presented as choices if more than one exists.
- The Valgrind view initially displays each snapshot in a table showing heap allocation statistics.
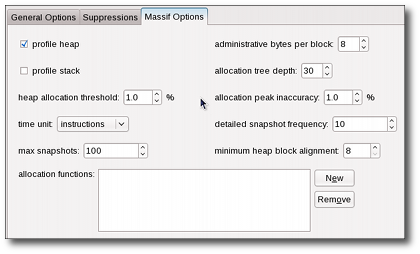
- Similarly to Memcheck, there are Massif-specific options configurable in the Valgrind Options tab for your profile configurations.


Using Cachegrind
- Cachegrind performs cache and branching profiling. It can measure the number of cache misses and branch mispredictions your program performs. (http://www.valgrind.org/docs/manual/cg-manual.html)
- To use Cachegrind, you need to switch the tool in your profile configuration.
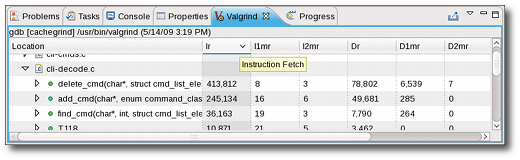
- In the Valgrind view, Cachegrind's cache/branch data is shown in various levels of granularity.
- A total is shown for each process and then you can navigate through each file, function and line.
- Double-clicking on any file, function or line will open an editor to it, if the source can be resolved.
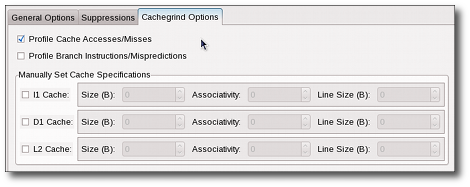
- As with the other tools, there are specific Cachegrind options available from the Valgrind Options tab in your profile configuration.


Special Cases
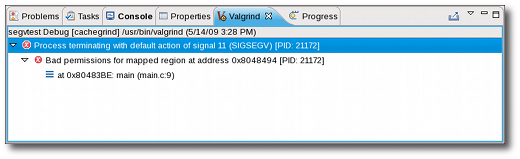
- In the event of an error in your program or with the options supplied to Valgrind, they will be reported in the Core Messages pane of the Valgrind view.
- This is where Memcheck does all of its reporting.
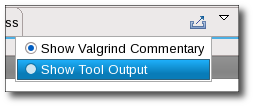
- For other tools, it is possible to switch between this pane and the tool's output in the view's menu.
- If your program does encounter some problem, any data collected by Valgrind is still reported.
- Profiling child processes is available in all tools and enabled by selected "Trace children on exec" in the profile configuration.
- Memcheck handles this transparently and lists the process ID (PID) for each error it reports.
- Massif presents each process separately and allows you to switch between them with the "Select Process ID"
 dropdown in the Valgrind view's toolbar.
 - Cachegrind reports each PID separately as a top-level element in it's output tree.

