Notice: This Wiki is now read only and edits are no longer possible. Please see: https://gitlab.eclipse.org/eclipsefdn/helpdesk/-/wikis/Wiki-shutdown-plan for the plan.
Difference between revisions of "Linux Tools Project/Valgrind/User Guide"
(→Using Cachegrind) |
(→Using Cachegrind) |
||
| Line 51: | Line 51: | ||
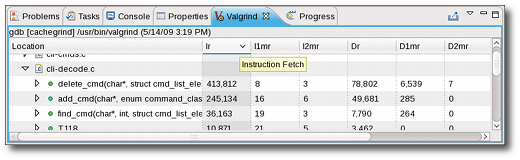
** A total is shown for each process and then you can navigate through each file, function and line. | ** A total is shown for each process and then you can navigate through each file, function and line. | ||
** Double-clicking on any file, function or line will open an editor to it, if the source can be resolved.<br/>[[Image:CachegrindOutput.png]] | ** Double-clicking on any file, function or line will open an editor to it, if the source can be resolved.<br/>[[Image:CachegrindOutput.png]] | ||
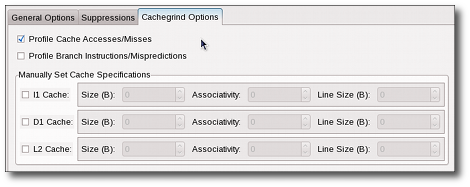
| − | * As with the other tools, there are specific Cachegrind options available from the Valgrind Options tab in your profile configuration. | + | * As with the other tools, there are specific Cachegrind options available from the Valgrind Options tab in your profile configuration.<br/>[[Image:CachegrindOptions.png]] |
== Special Cases == | == Special Cases == | ||
Revision as of 16:36, 14 May 2009
Contents
Overview
- Valgrind is a powerful and widely used memory profiling tool suite. (http://www.valgrind.org)
- This project aims to provide a useful integration of Valgrind tools with your Eclipse projects.
- Currently Memcheck, Massif and Cachegrind are supported.
- Valgrind 3.3.0 or greater is required.
Installing
- Add the update site (see: http://www.eclipse.org/linuxtools/downloads.php for details)
- Install Valgrind Integration from the update site.
General Usage
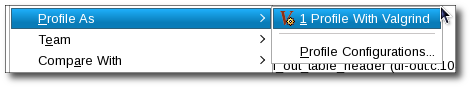
- The launch shortcut can create a configuration with default options for your program.
- Same as running
valgrind ./myprogfrom the command line. - After a configuration has already been created, the launch shortcut will launch your most recently used configuration.
- Same as running
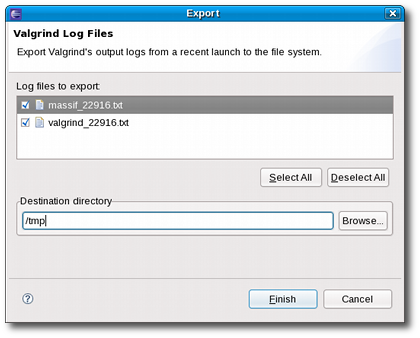
- If you wish to export the raw data Valgrind collects, an export wizard is available from either File->Export... or through the shortcut in the Valgrind view's toolbar.


Using Memcheck
- Memcheck discovers memory management problems in your program. (http://www.valgrind.org/docs/manual/mc-manual.html)
- It is the default tool.
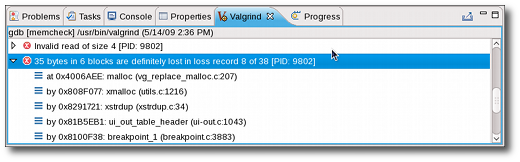
- Any memory management errors reported by Valgrind are listed in the Valgrind view, which should appear automatically.
- Each error has a stack trace.
- If the source can be resolved, double-clicking on the stack frame will open an editor to its line.
- View and modify your profile configuration by selecting "Profile Configurations".
- All Valgrind related configuration options can be changed from the Valgrind Options tab.
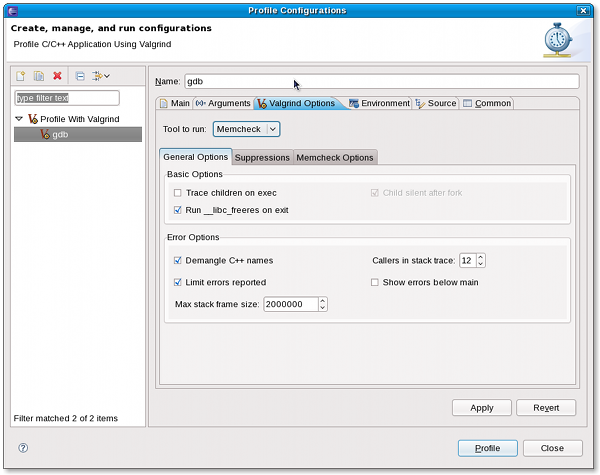
- General options and Suppressions are Valgrind core options and are not dependent on the tool being run.
- Details on Memcheck suppressions can be found here.
- Specific Memcheck options can also be configured.
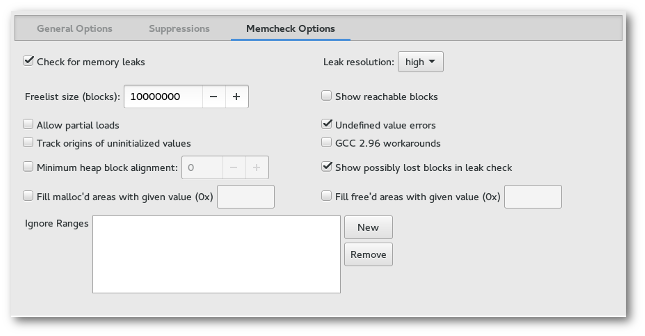
- All Valgrind related configuration options can be changed from the Valgrind Options tab.


Using Massif
- Massif is heap profiling tool that details memory usage throughout your program's execution. (http://www.valgrind.org/docs/manual/ms-manual.html)
- To use Massif, you need to switch the tool in your profile configuration.
- Massif has a lot of output to distil. There are 3 ways to view the data.
- Massif outputs statistics for each unit of time (default: instructions) in the application. These are called "snapshots" of your program.
- The Valgrind view initially displays each snapshot in a table showing heap allocation statistics.
- Some snapshots are detailed (denoted by
 ) and have a function call trace corresponding to contribution heap allocations.
 - The peak snapshot is in bold text.
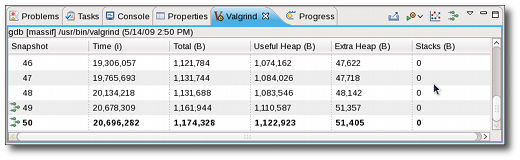
- Some snapshots are detailed (denoted by
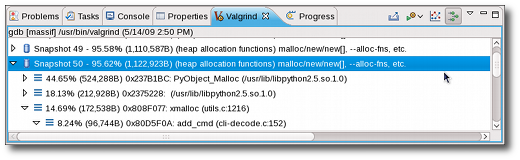
- Detailed snapshots can be inspected by double-clicking on them in the snapshot table.
- Each detailed snapshot is shown in a tree structure that forms a hierarchy of function calls accounting for that snapshot's allocations.
- Double clicking on any function with a source file listed will attempt to open an editor to it.
- Toggle between the snapshot table and detailed snapshot tree with the "Show Heap Tree" button in the view's toolbar.
- The data presented in the snapshot table is also shown in line chart form.
- Clicking on any data point selects it in the snapshot table.
- Double-clicking on any data point that corresponds to a detailed snapshot will open an editor to one of its function calls.
- The top-most function calls in the trace that contain source files are presented as choices if more than one exists.
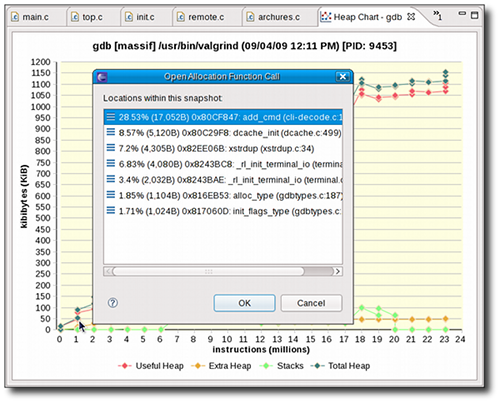
- The top-most function calls in the trace that contain source files are presented as choices if more than one exists.
- The Valgrind view initially displays each snapshot in a table showing heap allocation statistics.
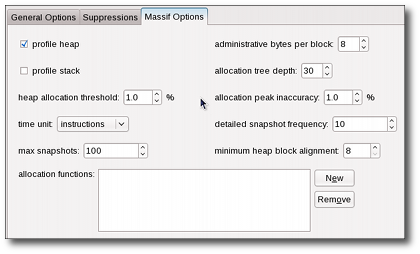
- Similarly to Memcheck, there are Massif-specific options configurable in the Valgrind Options tab for your profile configurations.


Using Cachegrind
- Cachegrind performs cache and branching profiling. It can measure the number of cache misses and branch mispredictions your program performs. (http://www.valgrind.org/docs/manual/cg-manual.html)
- To use Cachegrind, you need to switch the tool in your profile configuration.
- In the Valgrind view, Cachegrind's cache/branch data is shown in various levels of granularity.
- A total is shown for each process and then you can navigate through each file, function and line.
- Double-clicking on any file, function or line will open an editor to it, if the source can be resolved.
- As with the other tools, there are specific Cachegrind options available from the Valgrind Options tab in your profile configuration.


Special Cases
- In the event of an error in your program or with the options supplied to Valgrind, they will be reported in the Core Messages pane of the Valgrind view.
- This is where Memcheck does all of its reporting.
- For other tools, it is possible to switch between this pane and the tool's output in the view's menu.
- If your program does encounter some problem, any data collected by Valgrind is still reported.
- Profiling child processes is available in all tools and enabled by selected "Trace children on exec" in the profile configuration.
- Memcheck handles this transparently and lists the process ID (PID) for each error it reports.
- Massif presents each process separately and allows you to switch between them with the "Select Process ID"
 dropdown in the Valgrind view's toolbar.
 - Cachegrind reports each PID separately as a top-level element in it's output tree.