Notice: This Wiki is now read only and edits are no longer possible. Please see: https://gitlab.eclipse.org/eclipsefdn/helpdesk/-/wikis/Wiki-shutdown-plan for the plan.
Difference between revisions of "JSDT/Debug/Rhino/Using Rhino Console"
(→Attaching the Debugger) |
|||
| Line 67: | Line 67: | ||
in <code>debug</code> mode. | in <code>debug</code> mode. | ||
| − | Once a new configuration is created we have to configure it to use the Mozilla Rhino - Attaching Connector and set the port and host to be the same as what you used to start the console. Mainly you only have to worry about setting the port, as the console currently does not support being started on a remote host. | + | Once a new configuration is created we have to configure it to use the <pre>Mozilla Rhino - Attaching Connector</pre> and set the port and host to be the same as what you used to start the console. Mainly you only have to worry about setting the port, as the console currently does not support being started on a remote host. |
Once configured your configuration should look like the following: | Once configured your configuration should look like the following: | ||
| Line 81: | Line 81: | ||
Image:Debugview-rhino.png|Example Rhino launch in the Debug View | Image:Debugview-rhino.png|Example Rhino launch in the Debug View | ||
</gallery> | </gallery> | ||
| + | |||
== Console Commands == | == Console Commands == | ||
Revision as of 15:59, 19 November 2010
| JSDT Debug | |
| Website | |
| Download | |
| Community | |
| Mailing List • Forums • IRC • mattermost | |
| Issues | |
| Open • Help Wanted • Bug Day | |
| Contribute | |
| Browse Source • Project Set File |
Contents
Overview
The Rhino console can be a powerful way to work with JavaScript within Rhino. Simply put, the Rhino console allows you to interact with the Rhino interpreter using System.in and System.out. You can also debug these interactions with a Remote JavaScript launch configuration.
The details of the console, and what it supports can be found here.
Starting the Console
There are many ways to start the console and we will discuss two of them here:
- start the console from an Eclipse workspace
- start the console from a system terminal
From Eclipse
To start the console from within an Eclipse workspace, we first have to get the source for the org.eclipse.wst.jsdt.debug.rhino.debugger project. This project can be obtained by simply importing the team project set for the JSDT debugger found here.
Once the source has been added to your workspace and has been built, we have to create a new Java Application launch configuration for the org.eclipse.wst.jsdt.debug.rhino.debugger.shell.DebugShell class. When creating the new launch configuration, there are some options for the launch that we should mention.
The following table summarizes the supported options for launching the Rhino console.
| Option | What it does | Example |
|---|---|---|
| -port | Allows you to specify the port that the console should communicate on | -port 5000
|
| -suspend | Allows to specify if the console should start and then wait until a debugger connects before continuing | -suspend true OR -suspend y
|
| -trace | Allows you to specify if the console should output status messages | -trace true
|
At this point you should have a new Java Application launch configuration that looks like the following (assuming you added the -port and -suspend options):
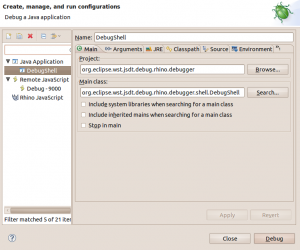
The Main tab of the new configuration
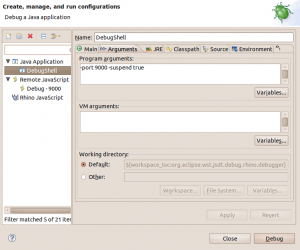
The Arguments tab of the new configuration


Regardless of your use of the -suspend option, at this point the console can be connected to by a remote debugger.
From the Terminal
Attaching the Debugger
After following the steps outlined in [Starting_the_Console] you should have the Rhino console up and running and see something like the following, either in your terminal or the Eclipse console:
Rhino debugger
Start at time: November 19, 2010 11:21:51 CST AM
Listening to socket on port: 9000
Rhino 1.7 release 2 2009 03 22
js>
The next thing we want to do is attach the remote debugger to be able to debug whatever we do in the console.
First thing we have to do is create a new Remote JavaScript launch configuration. This can only be done in launch configuration dialog opened
in debug mode.
Mozilla Rhino - Attaching Connectorand set the port and host to be the same as what you used to start the console. Mainly you only have to worry about setting the port, as the console currently does not support being started on a remote host.
Once configured your configuration should look like the following:
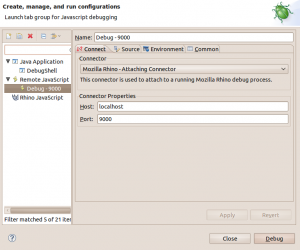
The connect tab of a Remote JavaScript configuration

The last step is to launch the configuration. Once launched you should see a new Rhino debug target in the Debug View and the usual commands enabled and ready to use.
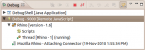
Example Rhino launch in the Debug View

Console Commands
Very good information about all of the supported commands and their effects can be found here.