Notice: this Wiki will be going read only early in 2024 and edits will no longer be possible. Please see: https://gitlab.eclipse.org/eclipsefdn/helpdesk/-/wikis/Wiki-shutdown-plan for the plan.
Zest/DOT
This is a work in progress wiki page for a Google Summer of Code 2009 project proposal. The goal of this project is to implement the Graphviz DOT language as a DSL for Zest: The Eclipse Visualization Toolkit, both as an input and output format, meaning that both a DOT graph description should be transformable to equivalent Zest visualizations, and that Zest visualizations should be exportable as DOT descriptions that can be rendered with Graphviz.
Motivation
I believe both Graphviz input and output for Zest would make a lot of sense: Graphviz is a very popular tool and its DOT language is widely used. Support for it could make using Zest very easy for many people who are familiar with DOT.
It would also be useful for existing Eclipse tools that are based on Graphviz, like TextUML or EclipseGraphviz, and possibly others, for instance in the Mylyn rich task editor (for embedding DOT graphs in the wiki text markup, visualized with Zest).
On the output side, Zest could benefit from Graphviz output as it provides a way to produce high-quality export into different file formats, e.g. for printing Zest visualizations, or using them in digital publications.
Implementation
I plan to implement this functionality based on Eclipse Modeling technologies, in particular Xtext (part of TMF) and Xpand (part of M2T) for the input part and JET (also part of M2T) for the output. An Xtext grammar, parser and Xpand generators for Graphviz DOT already exist in openArchitectureWare (oAW) 4.3 (the relevant bundles org.openarchitectureware.graphviz.*, are now part of the EMF model visualizer project).
Based on this, my plan is to define Xpand model transformations that transform Graphviz DOT descriptions into Java code that creates an equivalent Zest visualization, and DOT graphs with subgraphs into Zest animations. To transform Zest graph instances to the Graphviz DOT language I plan to use JET. The sketched approach (see figure on the right) depends on Eclipse components only (Xtext, Xpand, JET, and oAW).
Examples
Below I provide two examples of what the input should look like and what I in principle plan to generate from that input.
Minimal
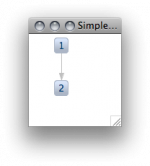
As a first example, consider the following minimal DOT graph and how it renders with Graphviz:
digraph simple { 1 -> 2 }
From this, the code below should be generated (comments to be generated omitted here). It's a Zest Graph subclass which is populated with the specified objects on construction, and includes export to DOT via a generator template generated by JET (commented out here to make the example compile). It also contains some sample usage code in a main method to make it runnable as a plain Java SWT application, with no additional runtime dependencies introduced besides the generator template, which could be bundled when generating the actual graph code. The code renders as shown on the image on the right.
/** Zest Graph to be generated from "digraph simple { 1 -> 2 }" */
public class SimpleDirectedGraph extends Graph {
    public SimpleDirectedGraph(Composite parent, int style) {
        super(parent, style);
        setConnectionStyle(ZestStyles.CONNECTIONS_DIRECTED);
        GraphNode n1 = new GraphNode(this, SWT.NONE, "1");
        GraphNode n2 = new GraphNode(this, SWT.NONE, "2");
        new GraphConnection(this, SWT.NONE, n1, n2);
        setLayoutAlgorithm(new TreeLayoutAlgorithm(
                LayoutStyles.NO_LAYOUT_NODE_RESIZING), true);
    }
    public String toString() {
        return super.toString(); // new GraphTemplate().generate(this);
    }
    public static void main(String[] args) {
        Display d = new Display();
        Shell shell = new Shell(d);
        shell.setText(SimpleDirectedGraph.class.getSimpleName());
        shell.setLayout(new FillLayout());
        shell.setSize(100, 150);
        new SimpleDirectedGraph(shell, SWT.NONE);
        shell.open();
        while (!shell.isDisposed()) {
            while (!d.readAndDispatch()) { d.sleep(); }
        }
    }
}
Animation
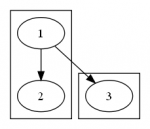
In contrast to Graphviz, which only provides static graph visualization, Zest supports animations. By combining the Graphviz DOT language with Zest in a similar manner as described above, creating simple animations with Zest could become very easy. For instance, defining an animation could be done by defining the individual animation steps as subgraphs as below, which render in individual boxes with Graphviz.
digraph simple_animation {
    subgraph cluster_0{ 1 -> 2 }
    subgraph cluster_1{ 1 -> 3 }
}
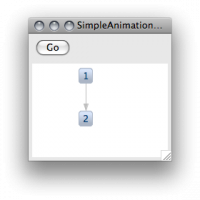
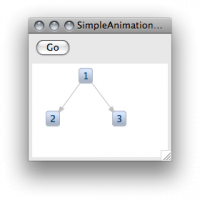
When visualized with Zest, I would add an option to render subgraphs as animation steps, with every subgraph defining how the current graph should be altered. It should result in generated code as below (comments to be generated again omitted here). When executed, this Zest application renders as on the first image on the right. After clicking the button it changes to the second image.
public class SimpleAnimationGraph extends Graph {
    public SimpleAnimationGraph(Composite parent, int style) {
        super(parent, style);
        setConnectionStyle(ZestStyles.CONNECTIONS_DIRECTED);
        setLayoutAlgorithm(new TreeLayoutAlgorithm(LayoutStyles.NO_LAYOUT_NODE_RESIZING), true);
        final GraphNode n1 = new GraphNode(this, SWT.NONE, "1");
        final GraphNode n2 = new GraphNode(this, SWT.NONE, "2");
        new GraphConnection(this, SWT.NONE, n1, n2);
    }
    public String toString() {
        return super.toString(); // new GraphTemplate().generate(this);
    }
    static class AnimationRunner implements Runnable {
        private Graph g;
        public AnimationRunner(Graph g) { this.g = g; }
        public void run() {
            Animation.markBegin();
            new GraphConnection(g, SWT.NONE, (GraphNode) g.getNodes().get(0),
                    new GraphNode(g, SWT.NONE, "3"));
            g.applyLayout();
            Animation.run(1000);
        }
    }
    public static void main(String[] args) {
        Display d = new Display();
        final Shell shell = new Shell(d);
        shell.setText(SimpleAnimationGraph.class.getSimpleName());
        shell.setLayout(new GridLayout(1,false));
        shell.setSize(200, 200);
        Button b1 = new Button(shell, SWT.PUSH);
        b1.setText("Go");
        final Graph g = new SimpleAnimationGraph(shell, SWT.NONE);
        g.setLayoutData(new GridData(GridData.FILL_BOTH));
        b1.addSelectionListener(new SelectionListener() {
            public void widgetDefaultSelected(SelectionEvent e) {}
            public void widgetSelected(SelectionEvent e) { new AnimationRunner(g).run(); }
        });
        shell.open();
        while (!shell.isDisposed()) {
            while (!d.readAndDispatch()) { d.sleep(); }
        }
    }
}
Required imports for these examples (omitted above for better readability):
import org.eclipse.draw2d.Animation;
import org.eclipse.swt.SWT;
import org.eclipse.swt.events.SelectionEvent;
import org.eclipse.swt.events.SelectionListener;
import org.eclipse.swt.layout.GridData;
import org.eclipse.swt.layout.GridLayout;
import org.eclipse.swt.widgets.Button;
import org.eclipse.swt.widgets.Composite;
import org.eclipse.swt.widgets.Display;
import org.eclipse.swt.widgets.Shell;
import org.eclipse.zest.core.widgets.Graph;
import org.eclipse.zest.core.widgets.GraphConnection;
import org.eclipse.zest.core.widgets.GraphNode;
import org.eclipse.zest.core.widgets.ZestStyles;
import org.eclipse.zest.layouts.LayoutStyles;
import org.eclipse.zest.layouts.algorithms.TreeLayoutAlgorithm;
Usage
From an end-user perspective, I plan to make the described functionality available in the following ways: a Zest wizard that creates a basic Zest application as above from a Graphviz DOT file or from input inside the wizard (see M3 below).
Expanding on that, a Zest project type where the DOT files are placed in a special folder (and can be edited conveniently using the DOT editor from oAW). Using a project builder, the corresponding Zest Graph implementations should be created and can be used from other parts of the application's code, similar to JET templates and generators (see M4 below).
Finally, transformations which allow using the Zest-based visualization view from the EMF model visualizer project, which is based on a DSL similar to DOT. This would provide visualization of DOT graphs with Zest inside a workbench (see M6 below).
Timeline
Based on the ideas described above, I propose the following timeline:
| Milestone | Weeks | Date | What | How |
| M1 | 1 | 2009-05-31 | Provide core Graphviz import by creating standalone Zest | Generate basic Zest code from a DOT meta model instance (using Xpand) |
| M2 | 2 | 2009-06-14 | Provide core Graphviz export for standalone Zest | Create DOT output from a Zest graph instance (using JET) |
| M3 | 1 | 2009-06-21 | Provide UI for initial Graphviz to Zest import | Wizard for a new Zest Graph with DOT export based on a DOT file or direct input |
| M4 | 1 | 2009-06-28 | Provide UI for maintaining Graphviz representations of Zest visualizations | Project builder, wizard and nature for Zest projects that create Zest graphs from Graphviz DOT files in a dedicated folder |
| M5 | 2 | 2009-07-12 | Provide basic form of a Graphviz-compatible animation DSL for Zest | Animation support for the M1 DOT to Zest transformations (representing animation steps as subgraphs) |
| (Mid-term) | - | 2009-07-13 | - | - |
| M6 | 1 | 2009-07-19 | Provide support for the Zest-based EMF model visualizer view | Transformation from DOT meta model instances to EMF model visualizer language (using Xpand) |
| M7 (optional) | 1.5 | 2009-07-30 | optional: Make standalone Zest and Graphviz DOT export available for the EMF model visualizer DSL | Transformation from EMF model visualizer meta model instances to the DOT language (using Xpand) |
| M8 (optional) | 1.5 | 2009-08-09 | optional: Provide support for exporting Zest graphs to an image directly (instead of exporting to DOT only) | Use existing Xpand transformation in oAW which create a batch file that calls a local Graphviz installation |
| RC | 1 | 2009-08-16 | Wrap up | Complete and polish documentation, tests and packaging |
| (Pencils down) | - | 2009-08-17 | - | - |


