Notice: this Wiki will be going read only early in 2024 and edits will no longer be possible. Please see: https://gitlab.eclipse.org/eclipsefdn/helpdesk/-/wikis/Wiki-shutdown-plan for the plan.
Difference between revisions of "Visualizing and Editing Graphs"
(New page: = Visualizing and Editing Graphs (Under Construction) = STEM uses color providers to determine the colors used for painting the map that appears during a simulation. The system goes throu...) |
(→Visualizing and Editing Graphs) |
||
| (17 intermediate revisions by 4 users not shown) | |||
| Line 1: | Line 1: | ||
| − | = Visualizing and Editing Graphs | + | = Visualizing and Editing Graphs = |
| − | STEM uses | + | STEM uses graphs as data structure to save information concerning population sizes, areas, spatial information, neighborhood of areas and so on. When you start a scenario, you get information about its appendent graphs in a visual form, e.g. when you see the outlines of the countries you included in your scenario. The Graph Editor allows you to visualize graphs without starting a scenario. You can get a view of the data, edit titles and area sizes, add populations and adjust geographic information of a node. It also makes it possible to create new nodes and edges and to remove existing nodes and edges. |
| − | + | == Step 1. Open the Editor == | |
| − | + | When you right-click on an item of the type "Graph" within a project of the STEM Explorer, you will see a context-menu with an item "Display". Clicking on it visualizes the selected graph in the Graph Editor, if the graph contains nodes with spatial information. To visualize all graphs in a certain model, select the item "Display canonical graph" in the model's context menu. | |
| − | == | + | <gallery widths="300px" heights="300px"> |
| + | Image:StemOpenGraphEditor.png | Open Graph in Editor | ||
| + | Image:StemOpenGraphEditorModel.png | Open Model in Editor | ||
| + | </gallery> | ||
| − | + | == Step 2. Edit the Graph == | |
| − | + | ||
| − | + | The nodes of the graph are small circles, whose colors show the membership to a subgraph, i.e. when you have opened a canonical graph consisting of several countries, the country nodes will have different colors. When you click on a node, you get information about its title, its URI and all labels that are assigned to this node. Several of these values are editable. You can move a node by keeping the left mouse button pressed and dragging the node to the desired location. To add a label to a node (e.g. add information about population size or area of the node), remove a label or remove the node itself you have to right-click on the node and a context menu shows up. The parameters of a newly added label can be edited in the bottom part of the editor. | |
| − | == | + | <gallery widths="600px" heights="300px"> |
| + | Image:StemGraphEditorAddLabel.png | Node Context Menu | ||
| + | </gallery> | ||
| − | + | If you right-click in the graph, when no nodes and edges are selected, a context menu appears. This allows you to create a new node at the location, where you have right-clicked. The polygon of a newly created node is a rectangle, whose side length has to be specified in a dialog. | |
| − | + | ||
| − | + | <gallery widths="600px" heights="300px"> | |
| + | Image:StemGraphEditorAddNode.png | Add Node Context Menu | ||
| + | </gallery> | ||
| + | |||
| + | Edges can also be selected to display their properties (type of the edge, ...). Some of the properties can also be edited. Right-clicking on an edge shows a context menu that allows removing this edge. | ||
| + | |||
| + | <gallery widths="600px" heights="300px"> | ||
| + | Image:StemGraphEditorRemoveEdge.png | Edge Context Menu | ||
| + | </gallery> | ||
| + | |||
| + | To add an edge between two nodes, select the origin node. While holding the Ctrl key, right-click on the destination node to open the context menu. Different types of edges can be created. | ||
| + | |||
| + | <gallery widths="600px" heights="300px"> | ||
| + | Image:StemGraphEditorAddEdge.png | Add Edge Context Menu | ||
| + | </gallery> | ||
| + | |||
| + | You can zoom in and out with the mouse wheel. | ||
| + | |||
| + | == Step 3. Save the Graph == | ||
| + | |||
| + | To save an edited graph, you can select "Save Graph and Quit" (the changes are saved into the same files) or you select "Save Graph As" where you have to select a folder and filename. When you are working on references to graphs in the STEM graph/model repository, local copies of the references including your changes will be saved to the workspace. If you were working on local copies already, your files will be overwritten when "Save Graph" is selected. | ||
Latest revision as of 20:10, 4 April 2012
Contents
Visualizing and Editing Graphs
STEM uses graphs as data structure to save information concerning population sizes, areas, spatial information, neighborhood of areas and so on. When you start a scenario, you get information about its appendent graphs in a visual form, e.g. when you see the outlines of the countries you included in your scenario. The Graph Editor allows you to visualize graphs without starting a scenario. You can get a view of the data, edit titles and area sizes, add populations and adjust geographic information of a node. It also makes it possible to create new nodes and edges and to remove existing nodes and edges.
Step 1. Open the Editor
When you right-click on an item of the type "Graph" within a project of the STEM Explorer, you will see a context-menu with an item "Display". Clicking on it visualizes the selected graph in the Graph Editor, if the graph contains nodes with spatial information. To visualize all graphs in a certain model, select the item "Display canonical graph" in the model's context menu.
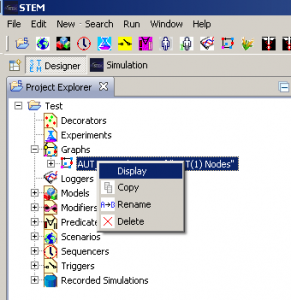
Open Graph in Editor
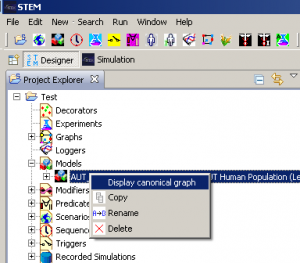
Open Model in Editor


Step 2. Edit the Graph
The nodes of the graph are small circles, whose colors show the membership to a subgraph, i.e. when you have opened a canonical graph consisting of several countries, the country nodes will have different colors. When you click on a node, you get information about its title, its URI and all labels that are assigned to this node. Several of these values are editable. You can move a node by keeping the left mouse button pressed and dragging the node to the desired location. To add a label to a node (e.g. add information about population size or area of the node), remove a label or remove the node itself you have to right-click on the node and a context menu shows up. The parameters of a newly added label can be edited in the bottom part of the editor.
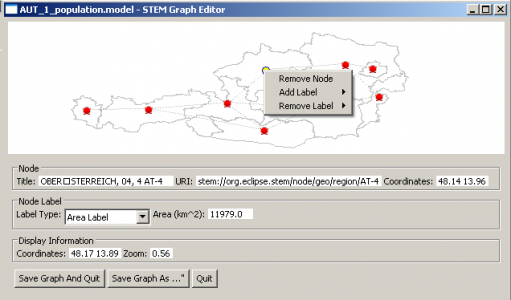
Node Context Menu

If you right-click in the graph, when no nodes and edges are selected, a context menu appears. This allows you to create a new node at the location, where you have right-clicked. The polygon of a newly created node is a rectangle, whose side length has to be specified in a dialog.
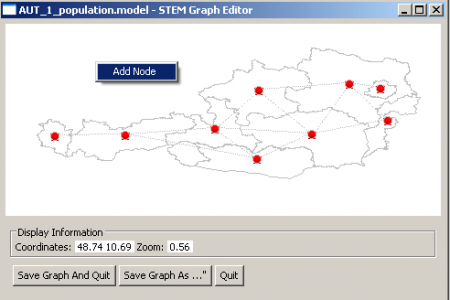
Add Node Context Menu

Edges can also be selected to display their properties (type of the edge, ...). Some of the properties can also be edited. Right-clicking on an edge shows a context menu that allows removing this edge.
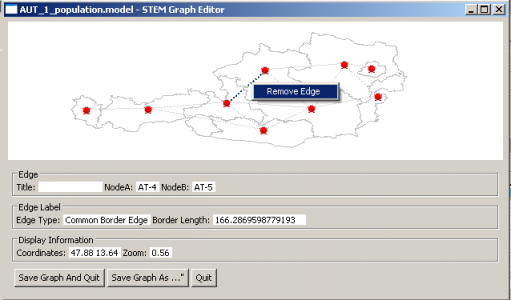
Edge Context Menu

To add an edge between two nodes, select the origin node. While holding the Ctrl key, right-click on the destination node to open the context menu. Different types of edges can be created.
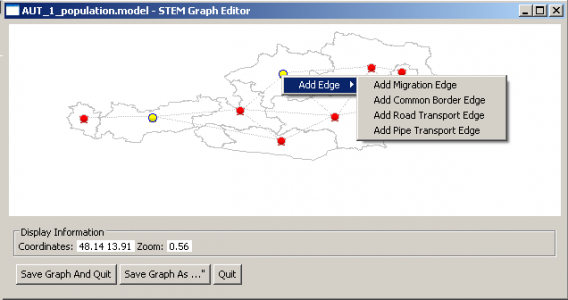
Add Edge Context Menu

You can zoom in and out with the mouse wheel.
Step 3. Save the Graph
To save an edited graph, you can select "Save Graph and Quit" (the changes are saved into the same files) or you select "Save Graph As" where you have to select a folder and filename. When you are working on references to graphs in the STEM graph/model repository, local copies of the references including your changes will be saved to the workspace. If you were working on local copies already, your files will be overwritten when "Save Graph" is selected.