Notice: this Wiki will be going read only early in 2024 and edits will no longer be possible. Please see: https://gitlab.eclipse.org/eclipsefdn/helpdesk/-/wikis/Wiki-shutdown-plan for the plan.
Difference between revisions of "Trace Compass/News/NewIn30"
(→Enables/Disable Trace Types) |
|||
| Line 22: | Line 22: | ||
[[Image:TraceTypesPreferencePage.png]] | [[Image:TraceTypesPreferencePage.png]] | ||
| + | |||
| + | = Aggregating threads in the Flame Graph = | ||
| + | |||
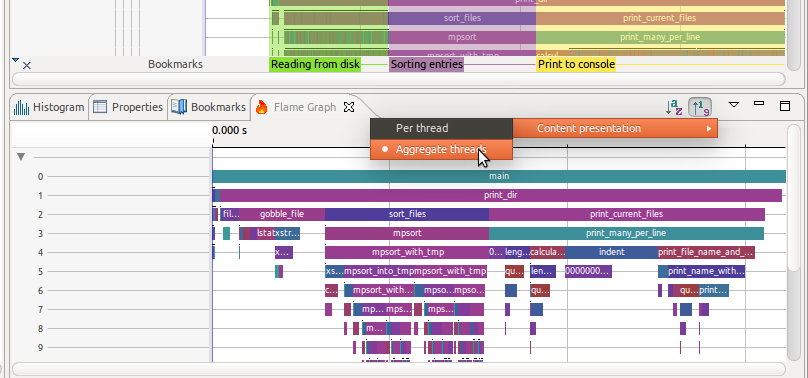
| + | The flame graph now allows aggregation of individual threads or display of a flame graph per thread. To change the layout, click on the drop-down menu and select the '''Content Presentation'''. | ||
| + | |||
| + | [[Image:FlameGraphLayout.png]] | ||
= Bugs fixed in the 3.0.0 release = | = Bugs fixed in the 3.0.0 release = | ||
See Bugzilla report [https://bugs.eclipse.org/bugs/buglist.cgi?bug_status=RESOLVED&bug_status=CLOSED&classification=Tools&product=Tracecompass&query_format=advanced&resolution=FIXED&target_milestone=3.0.0 Bugs Fixed in Trace Compass 3.0.0] | See Bugzilla report [https://bugs.eclipse.org/bugs/buglist.cgi?bug_status=RESOLVED&bug_status=CLOSED&classification=Tools&product=Tracecompass&query_format=advanced&resolution=FIXED&target_milestone=3.0.0 Bugs Fixed in Trace Compass 3.0.0] | ||
Revision as of 11:19, 20 April 2017
Contents
Configurable Marker Sets
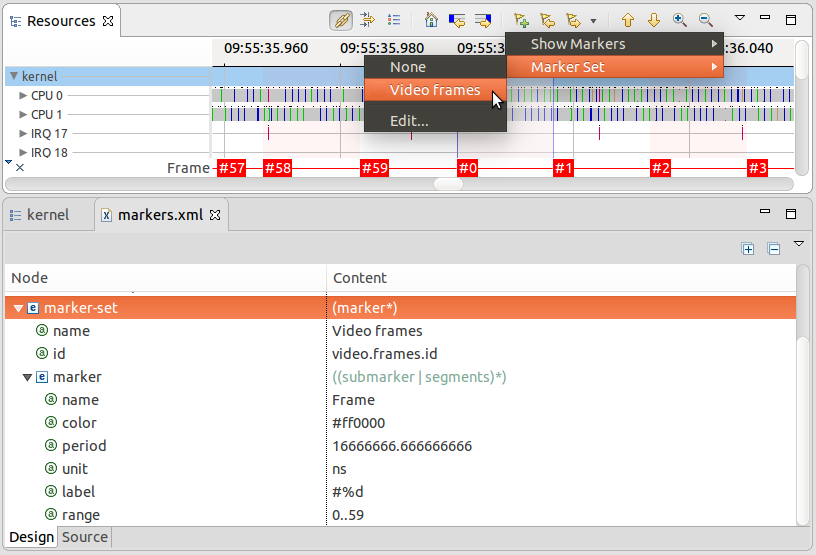
It is now possible for a user to configure marker sets to be visible in time graph views. The marker set defines a periodic marker with a specific period, reference and index range. The markers can further be split into equal length sub-markers or unequal length segments, recursively. The color, category, and label of each marker is configurable.
To configure a marker set, from the view menu select Marker Set > Edit..., and edit and save the XML file. To enable a marker set, select it from the same menu.
Display Trace Range in Project Explorer
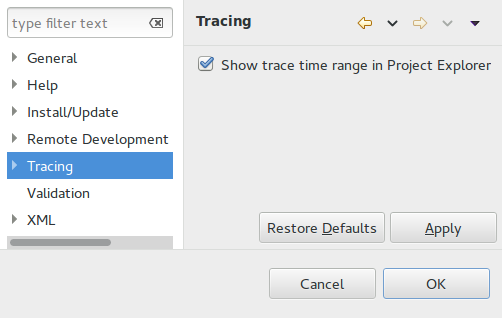
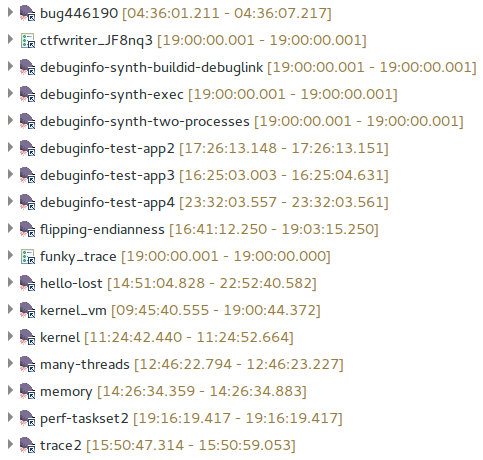
It is now possible to show the beginning and end time stamps for a trace in the project explorer. This is useful if you have many traces and know when an issue occurred. To activate this option, head to Preferences > Tracing and check the box Show trace time range in Project Explorer. The time is displayed in the Time Format from Tracing preferences.
If a trace is empty or its type unknown, nothing will be shown. It the range has not been fully read from the trace or the supplementary files, [...] will be shown. If the trace is being read and only its start time start is known, [start - ...] will be shown. Finally, when the end time end is also known, [start - end] will be shown.
Enable/Disable Trace Types
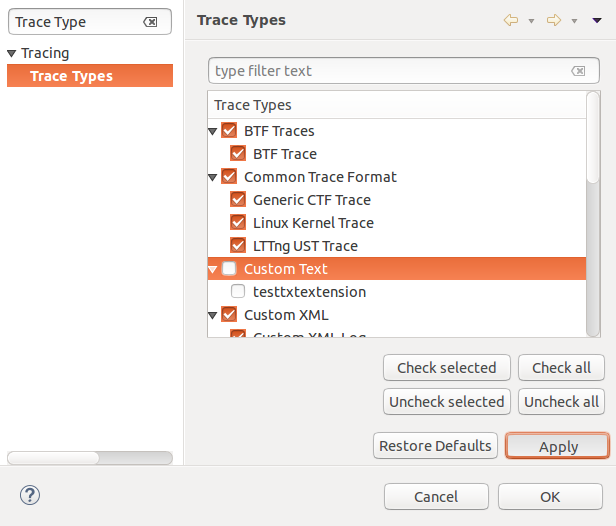
It is now possible to enable/disable the trace types through the Trace Types Preference Page. The enabled trace types will be available under the Select Trace Type... menu and will be used to import traces while the disabled trace types will be ignored. To open the Trace Type Preference Page, select Preferences > Tracing > Trace Types.
Aggregating threads in the Flame Graph
The flame graph now allows aggregation of individual threads or display of a flame graph per thread. To change the layout, click on the drop-down menu and select the Content Presentation.
Bugs fixed in the 3.0.0 release
See Bugzilla report Bugs Fixed in Trace Compass 3.0.0

