Notice: this Wiki will be going read only early in 2024 and edits will no longer be possible. Please see: https://gitlab.eclipse.org/eclipsefdn/helpdesk/-/wikis/Wiki-shutdown-plan for the plan.
Trace Compass/News/NewIn21
Contents
Operating system overview
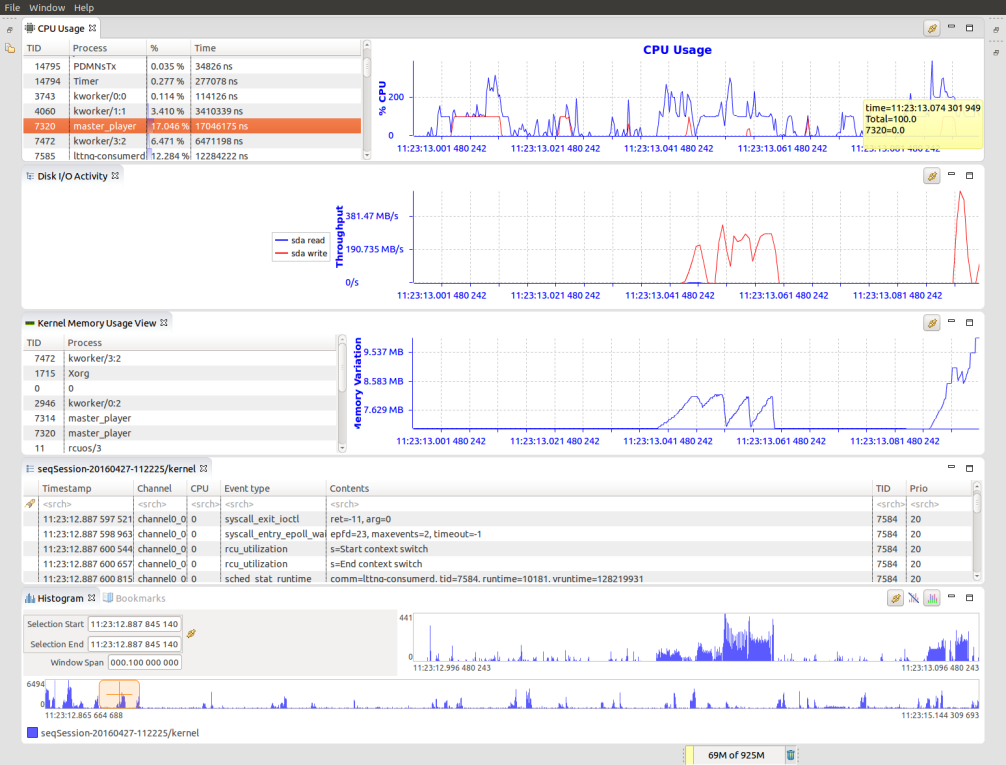
A new perspective with a set of predefined views is available showing CPU Usage, Disk I/O Activity and Kernel Memory Usage populated with from LTTng Kernel traces.
Call graph analysis
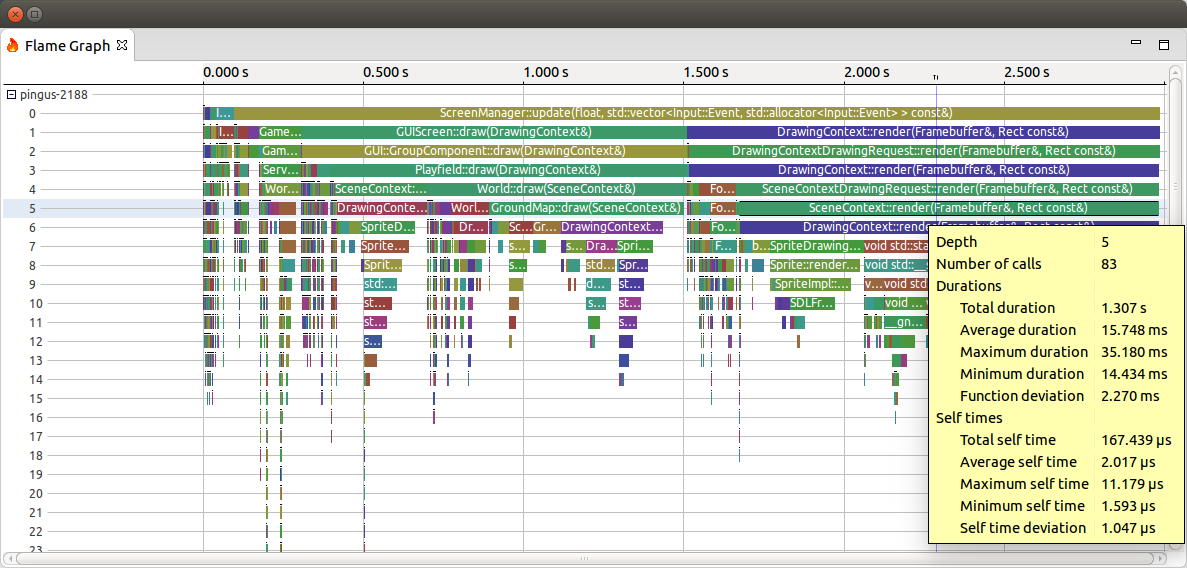
A new analysis has been added to analyze the call stack data provided by a call stack analysis (e.g. LTTng UST call stack analysis based on gcc's finstrument-functions). For that 2 new views are available to provide information on the performance of the traced application: Flame Graph view and Function Duration Density view.
Note: The current implementation is limited by the available RAM. Future improvements will be done to overcome this limitation.
Flame graph view
The Flame Graph view visualizes the aggregation of each function call duration per stack depth and per caller. The x-axis represents the function call duration. They are ordered by duration from left to right and it's easy to spot the function with longest duration and the code path that is used the most. The y-axis shows the call stack depth ordered from root at the top to leaf at the bottom. Multiple threads are grouped together in its own Flame Graph.
Function duration density view
The Function Duration Density view shows the distribution of function call duration over the current active window range.
LTTng Control view enhancements
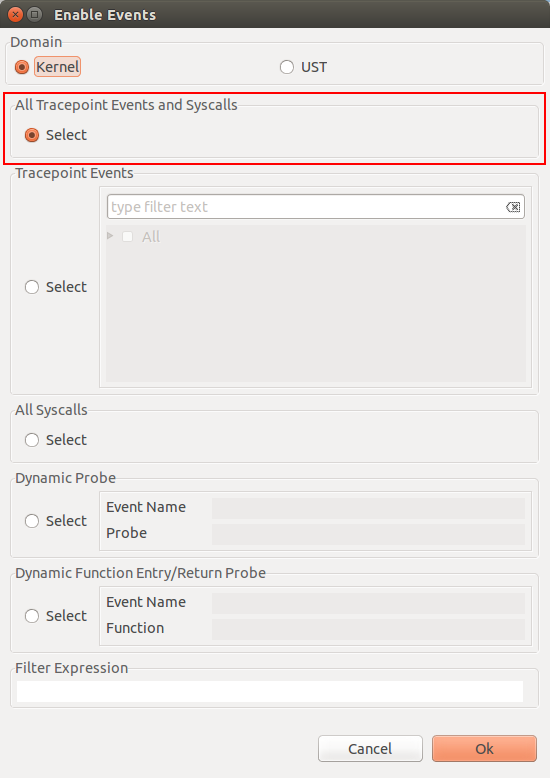
Enabling all kernel tracepoints and syscall at once
It is now possible to enable all LTTng kernel tracepoints and syscall at the same time.
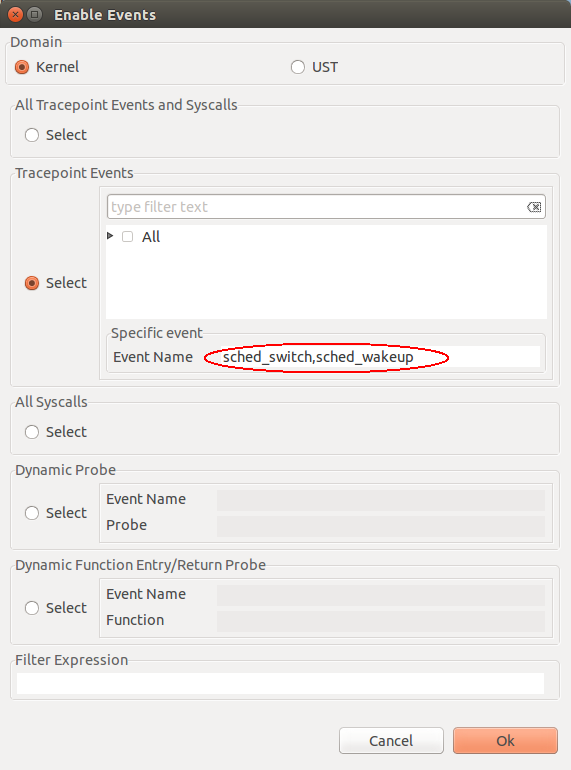
Enabling LTTng Kernel events by name
It is now possible to enable LTTng Kernel events by specifying one or more names. This is useful when tracing Kernel modules that are loaded manually.
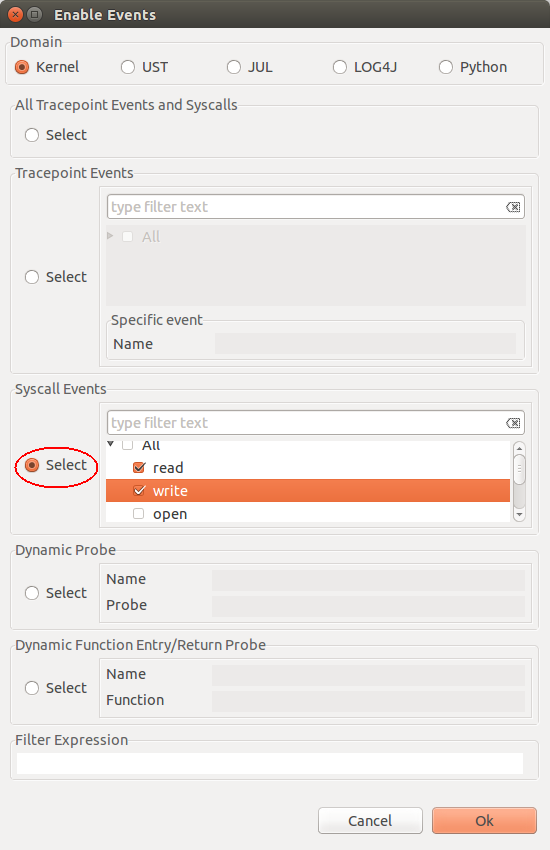
Enabling specific LTTng Kernel syscall events
It is now possible to specify which LTTng Kernel syscall(s) to enable when enabling syscall events. Previously, only enabling all syscalls was supported.
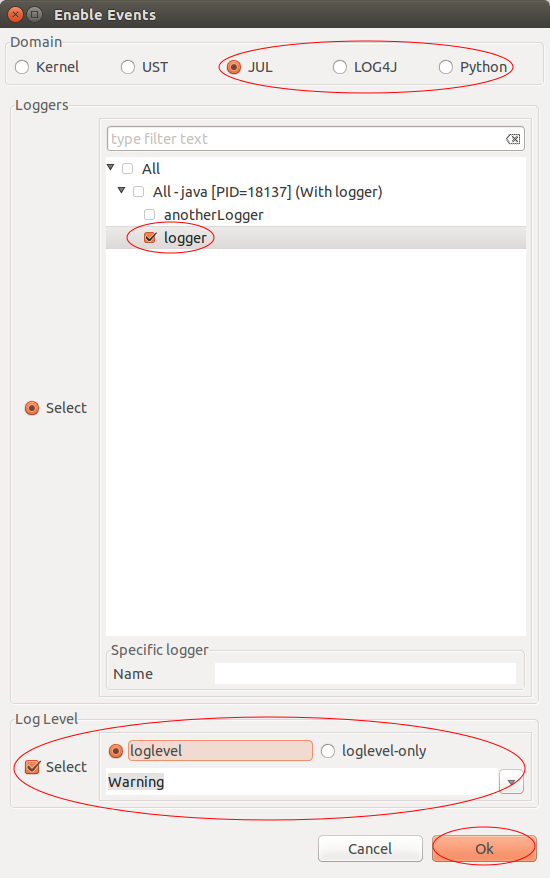
Support for tracing Java and Python applications
It is now possible to create tracing sessions to trace Java and Python applications. For java, the loggers can be either JUL (java.util.logging) or LOG4J (org.apache.log4). User can enable specific loggers with or without specifying the loglevels to apply.
Control Flow view enhancements
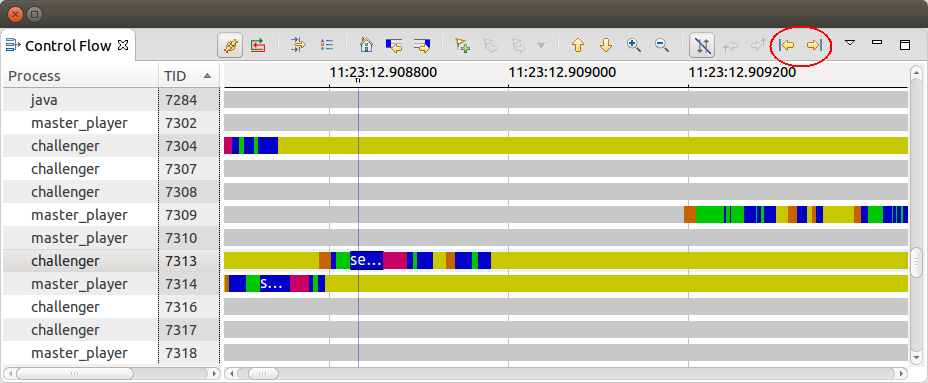
Following events per TID
Two navigation buttons have been added to the toolbar of the Control Flow view to follow events for the selected thread. With this is possible to go to the next or previous event from the current time for the selected thread.
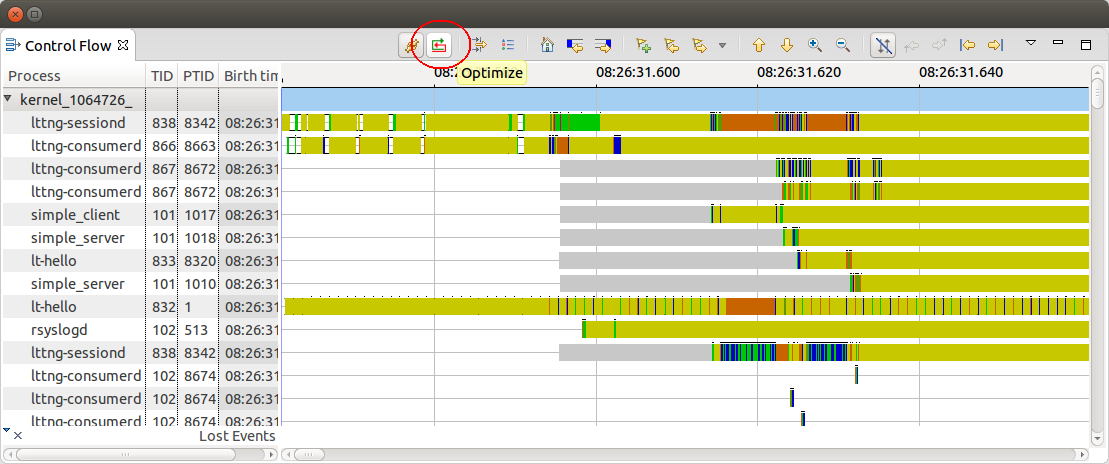
Optimizing threads grouping
Support for automatic threads grouping by activity using a graph placement algorithm has been added to the LTTng Control Flow view.
Custom Text/XML parser enhancements
Support for event types in custom parsers
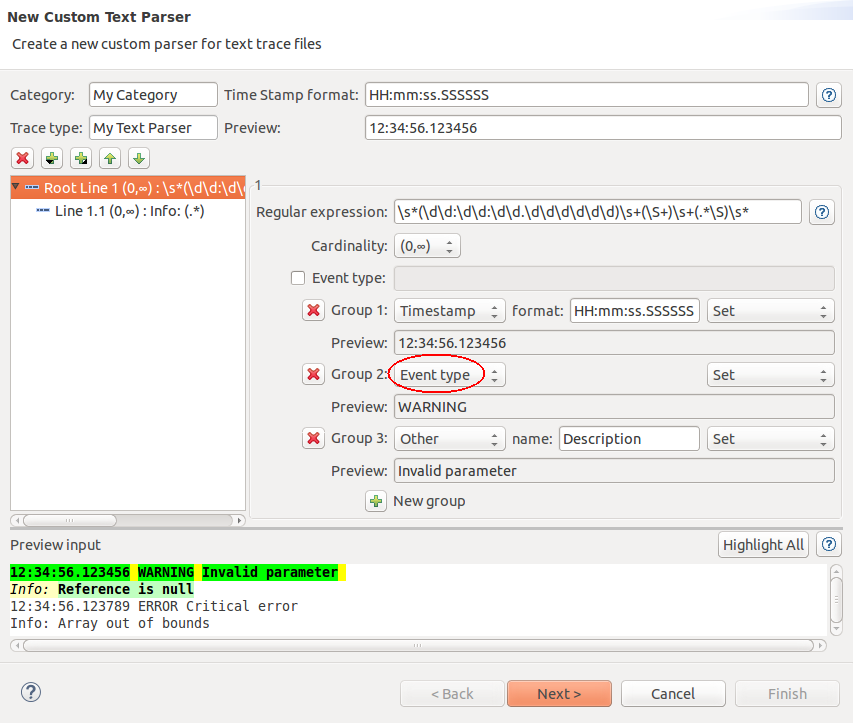
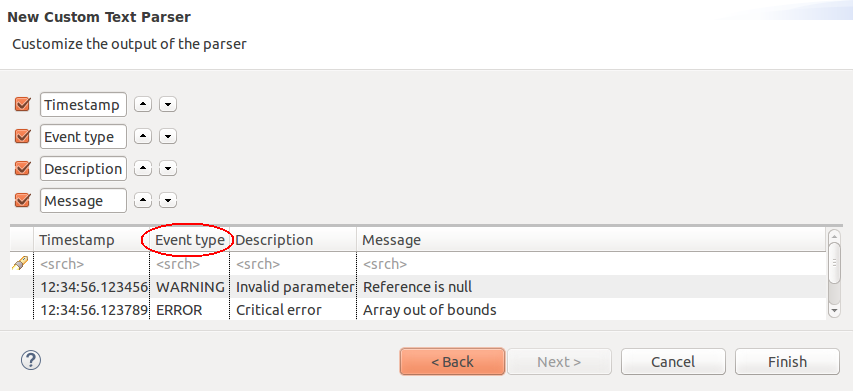
It is now possible to assign an event type in custom text and XML parser wizard.
The event type will be displayed in Event type column. Data-driven analysis can take advantage of the event type definition.
Latency analysis enhancements
Total latency statistics
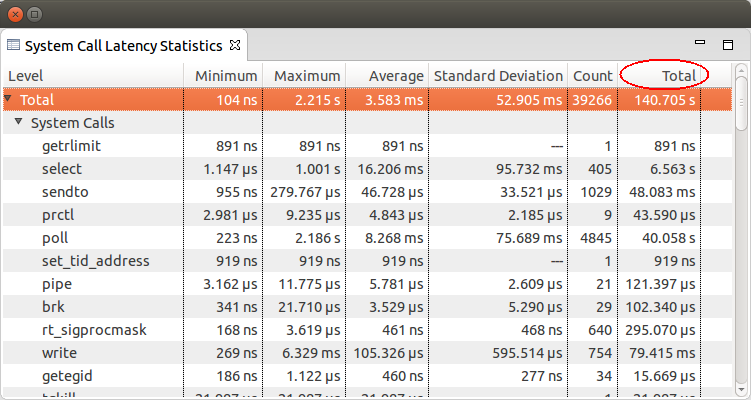
The Latency statistics view now will display the sum of a latencies per type in the Totals column. This is applicable to the Latency statistics view created by the data-driven pattern analysis or in Java like the System Call analysis.
Other enhancements
Open XML Editor for data-driven analysis
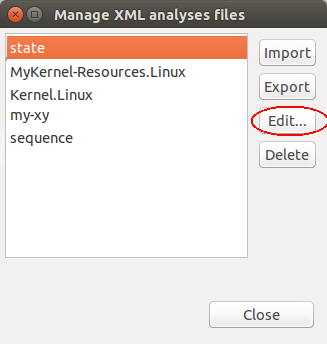
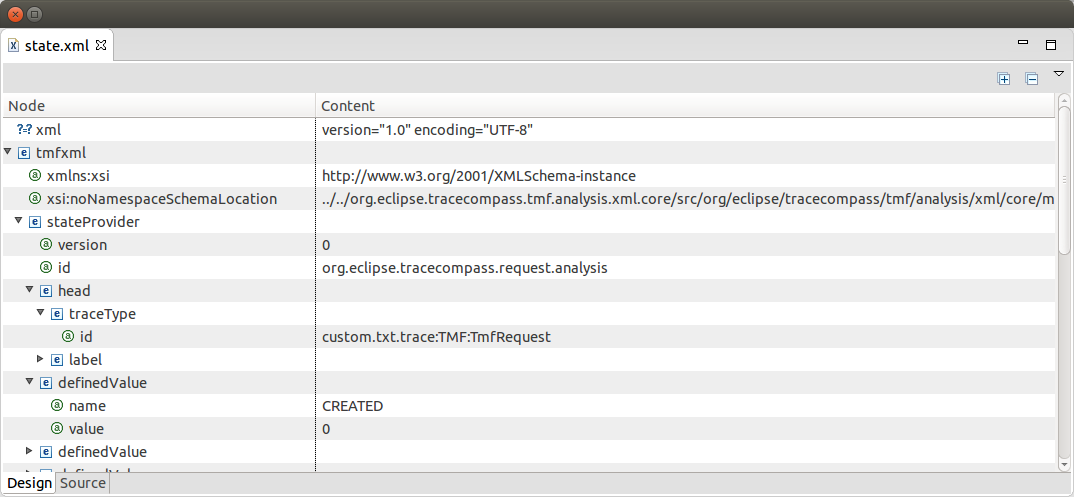
It is now possible to edit data-driven analyses directly within Trace Compass using the "Edit..." of the XML analysis manager.
This will open a XML editor provided by the Eclipse WST project.
Progress bar for indexing of CTF traces
The progressing of the trace indexing of CTF traces will be shown in the Progress view as well as the status bar of Trace Compass.
Bugs fixed in the 2.1.0 release
See Bugzilla report Bugs Fixed in Trace Compass 2.1.0

