Notice: this Wiki will be going read only early in 2024 and edits will no longer be possible. Please see: https://gitlab.eclipse.org/eclipsefdn/helpdesk/-/wikis/Wiki-shutdown-plan for the plan.
Trace Compass/News/NewIn20
Contents
- 1 Data-driven pattern detection
- 2 Time graph view improvements
- 3 System call latency analysis
- 4 Critical flow view
- 5 Virtual CPU view
- 6 Bookmarks and custom markers
- 7 Resources view improvements
- 8 Control Flow view Improvements
- 9 Support of vertical zooming in time graph views
- 10 Kernel memory usage analysis
- 11 Linux Input/Output analysis and views
- 12 Manage XML analysis files
- 13 Display of analysis properties
- 14 Importing traces as experiment
- 15 Importing LTTng traces as experience
- 16 Events Table filtering UI improvement
- 17 Visualization of debug info for source code lookup coming with LTTng 2.8 traces
- 18 Symbol provider for Call stack view
- 19 Per CPU thread 0
- 20 Improve analysis requirement implementations
- 21 Pie charts in Statistics view
- 22 LTTng Live trace reading support disabled
- 23 Bugs fixed in this release
Data-driven pattern detection
The data-driven analysis and view of Trace Compass has been augmented to support data-driven pattern analysis. With this it possible to define a pattern matching algorithm and populate Timing Analysis views (similar to the views of chapter #System call latency table). Other types of latency or timing analyses can be now defined using this approach.
Time graph view improvements
Gridlines in time graph views
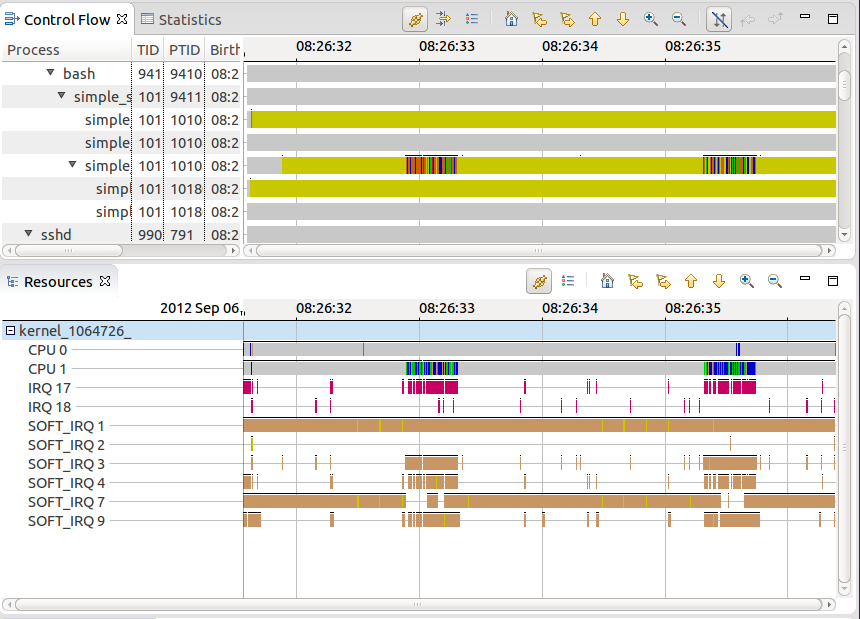
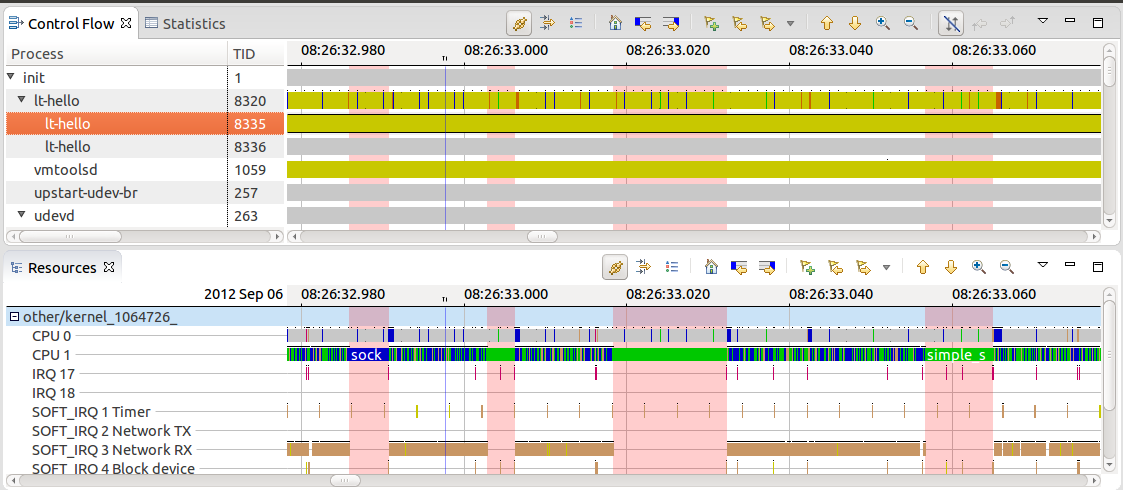
Grid lines have been added to the time graph views such as the Control Flow view.
Persist settings for open traces
All views based on the time graph widgets (e.g. Control Flow view) now persist the current row selection (e.g. threads), filters and sort order (where applicable) for all open traces. Switching traces won't erase the settings.
Support for searching within time graph views
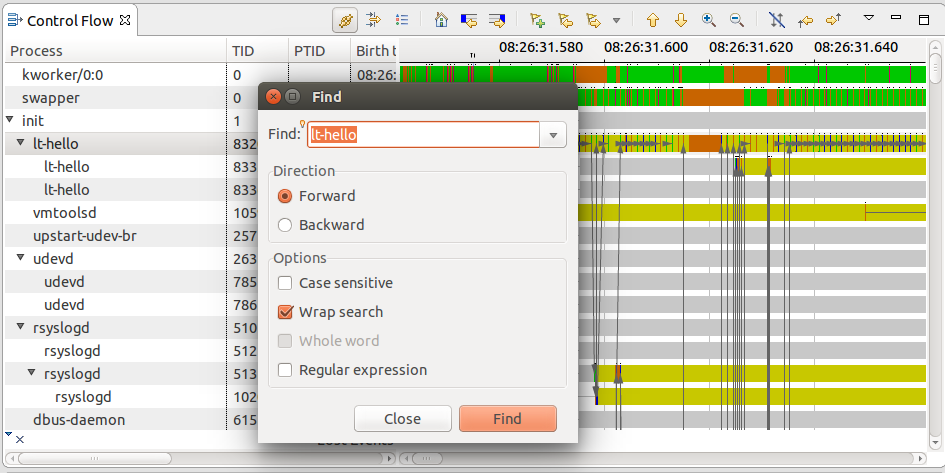
It is now possible to search in views based on the time graph views using CTRL+F keyboard short-cut. For example, with this users have the ability to search for a process, TID, PTID, etc. within the Control Flow view or a CPU, IRQ, etc. within the Resource view.
Horizontal scrolling using Shift+MouseWheel
It is possible to scroll horizontally within time graph views using Shift+MouseWheel on the horizontal scroll bar and within the time graph area.
Bookmarks and custom markers in time graph views
see chapter Bookmarks and custom markers
System call latency analysis
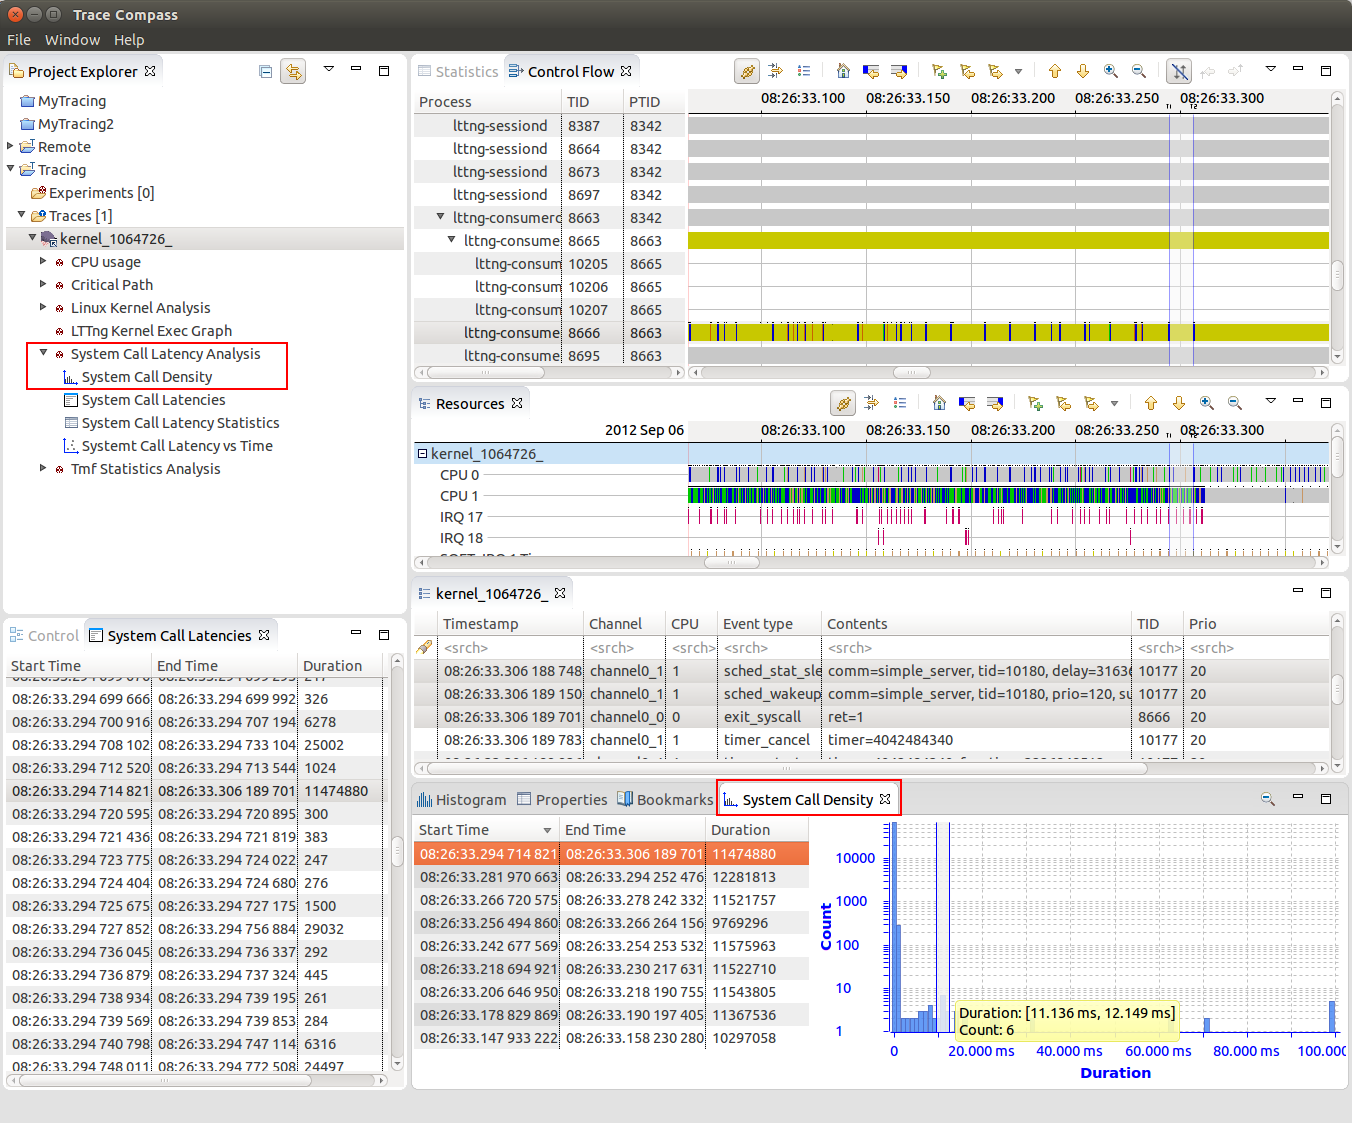
For analyzing of analyzing system call latencies in the Linux Kernel using LTTng kernel traces, the System Call Latency Analysis has been added. Various views will now display the results of the analysis in different ways.
System call latency table
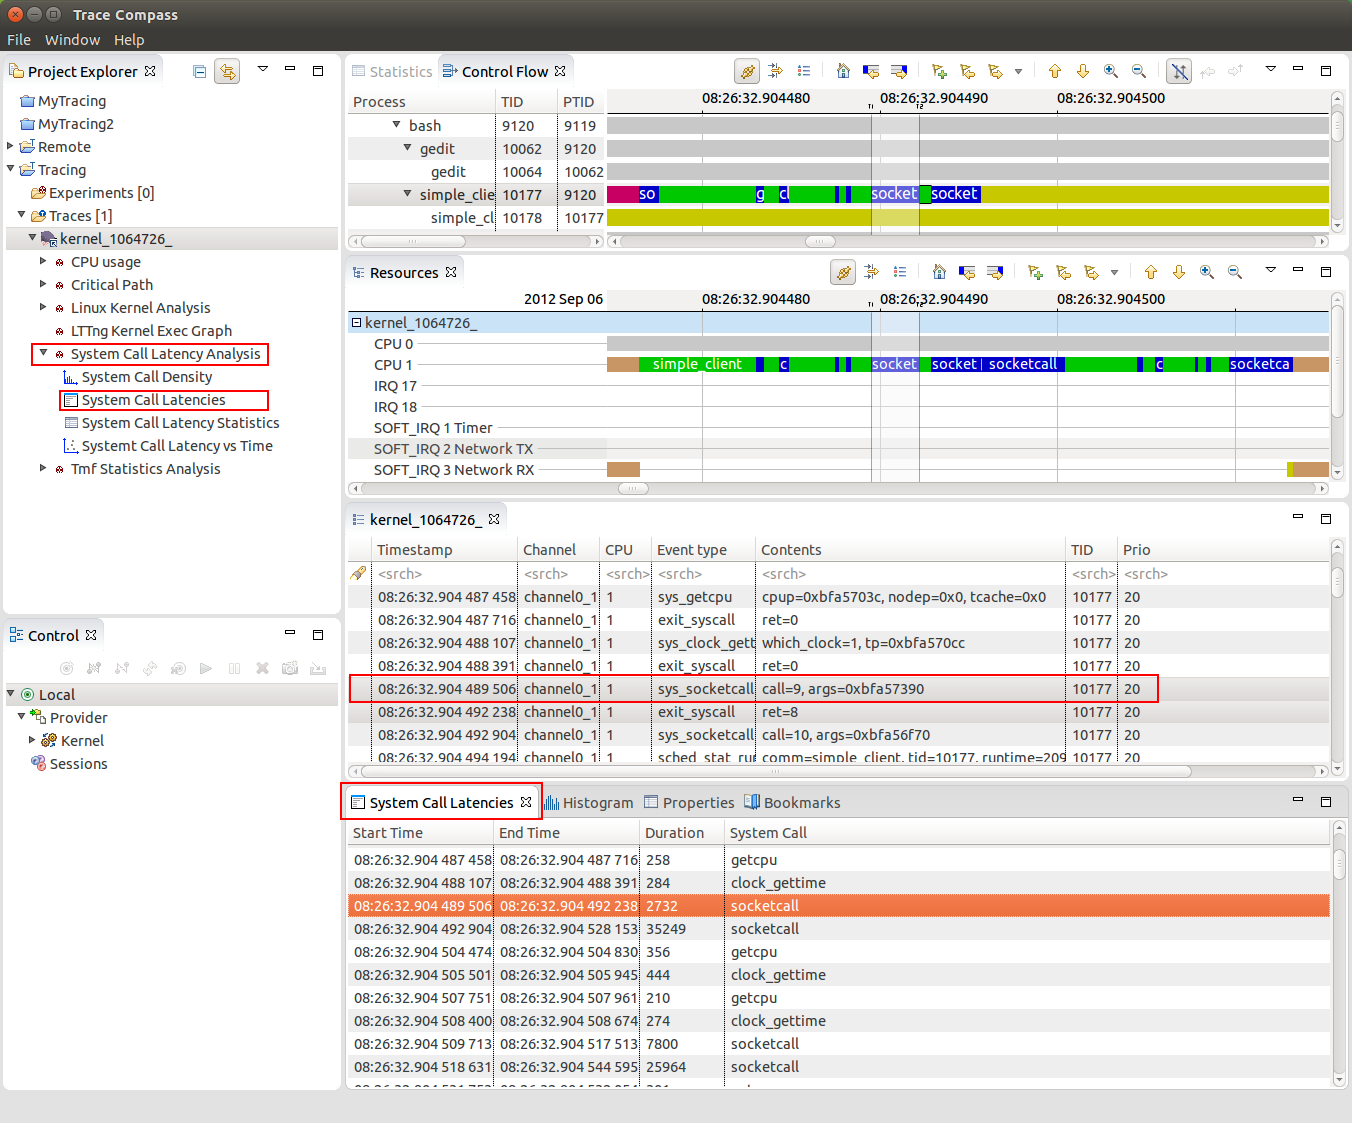
The System Call Latency table lists all latencies occurred per system call type occurred within the currently open trace.
System call latency scatter graph
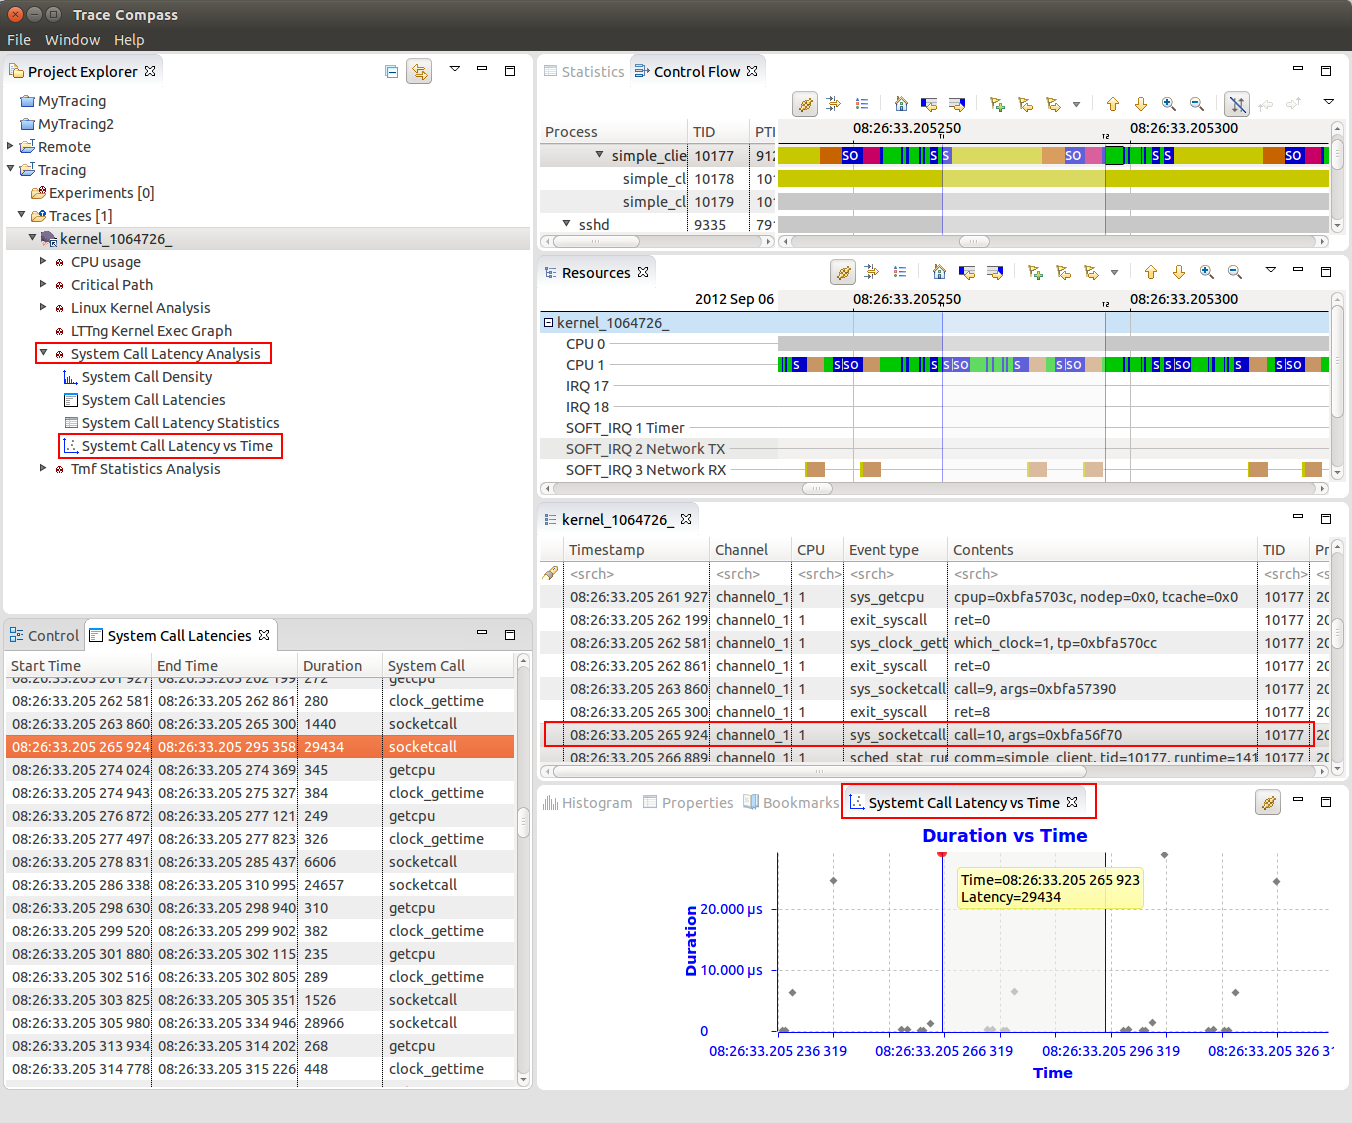
The System Call Latency vs Time view visualizes system call latencies in the Linux Kernel over time.
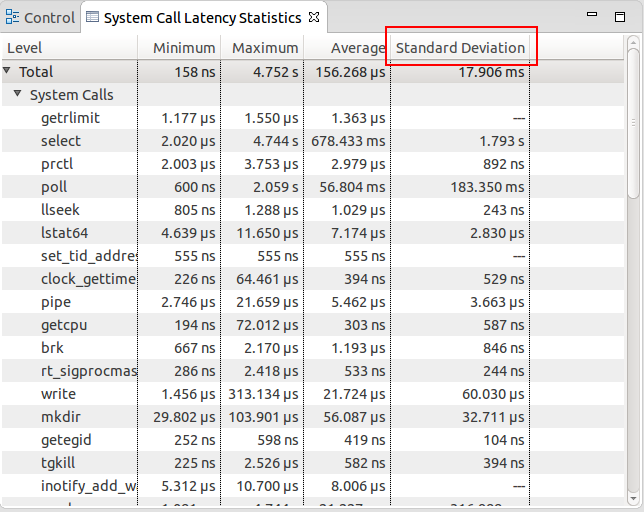
System call latency statistics
The System Call Latency Statistics view shows statistics about system call latencies. I lists the minimum, maximum and average latency as well as the standard deviation for a given system call type.
System call latency density
The System Call Density view shows the distribution of the latencies for the current selected time window of the traces.
Critical flow view
A critical flow analysis and view has been added to show dependency chains for a given process. Process priority information is part of the state tooltip. This makes it possible to detect if a higher priority process was block by a lower priority process.
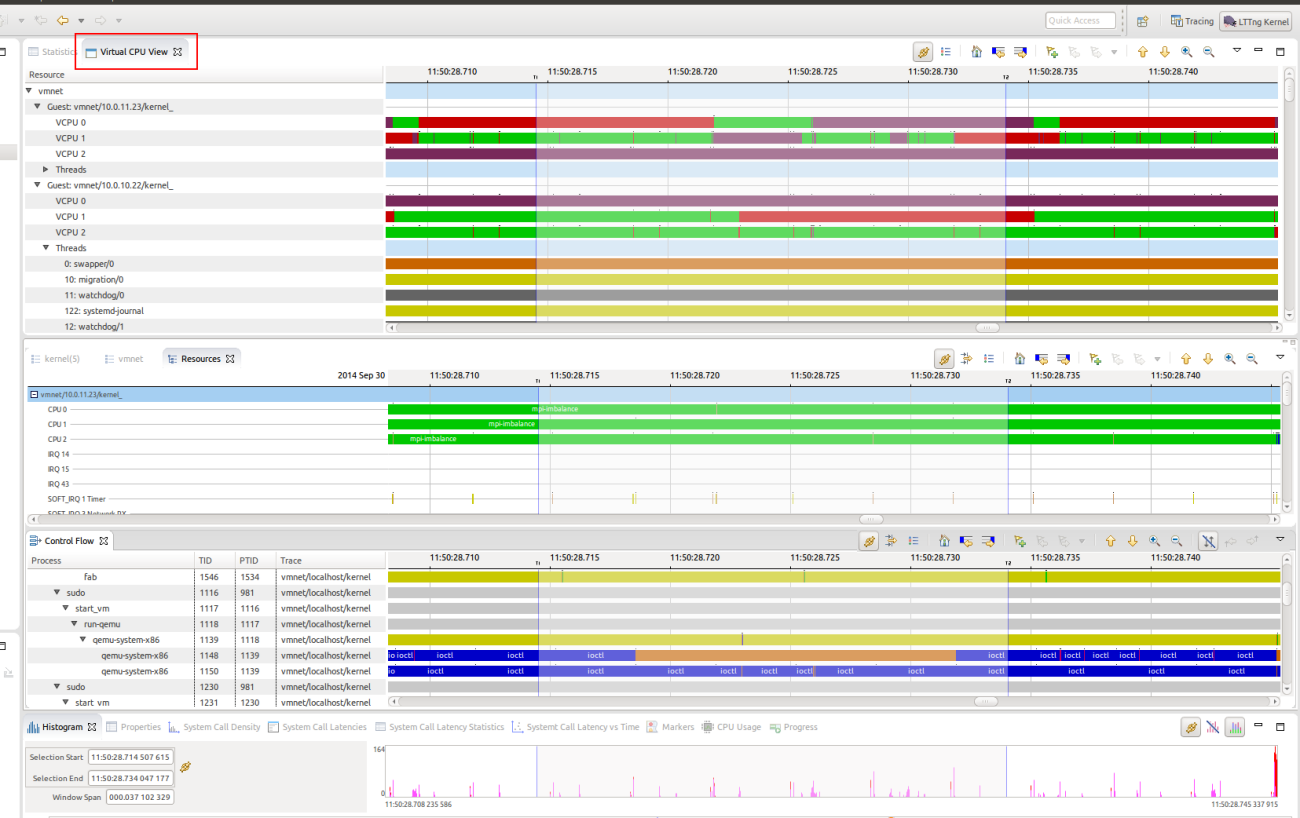
Virtual CPU view
To better understand what is happening in such a virtual environment, it is necessary to trace all the machines involved, guests and hosts, and correlate this information in an experiment that will display a complete view of the virtualized environment. The Virtual CPU view has been added for that.
In order to be able to correlate data from the guests and hosts traces, each hypervisor supported by Trace Compass requires some specific events, that are sometimes not available in the default installation of the tracer. For QEMU/KVM special LTTng kernel modules exist which need to be installed on the traced system. For more information, please follow the instructions in the Trace Compass user guide.
Bookmarks and custom markers
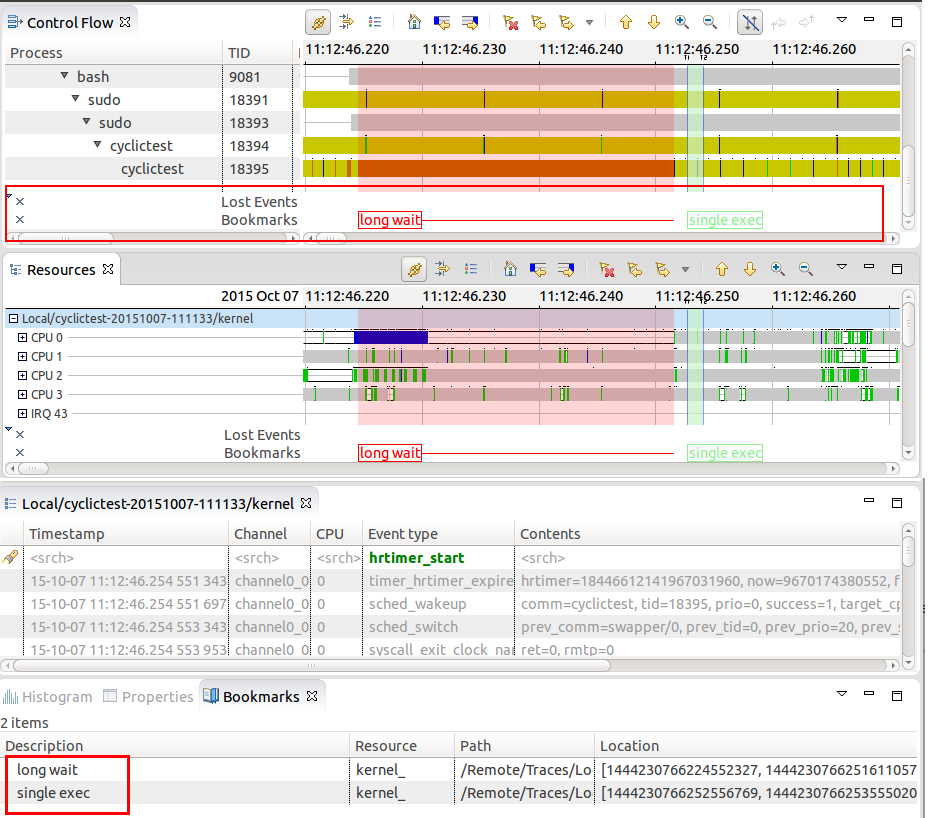
Support for user bookmarks in time graph views
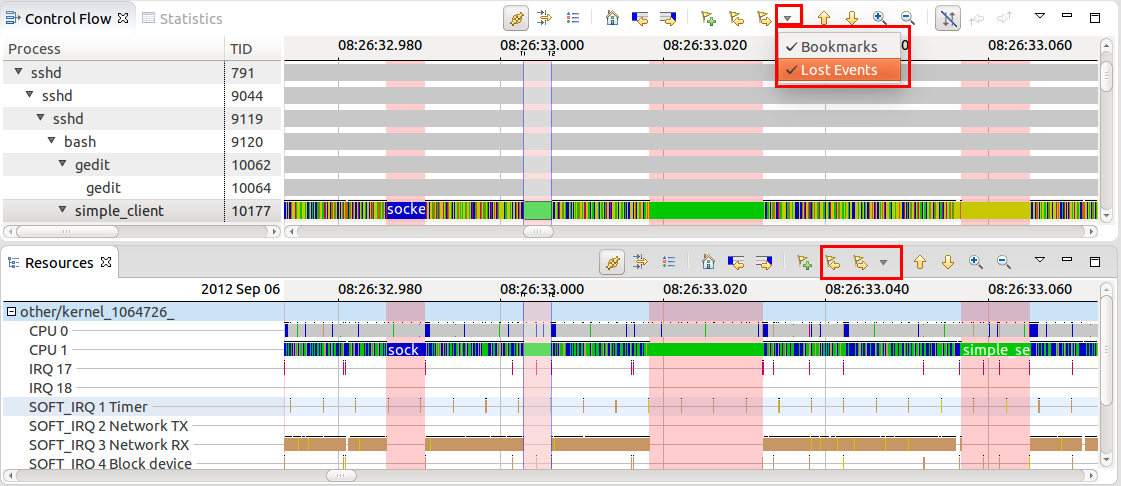
It is now possible to create bookmarks in time graph view for a single or time range selection. This will allow users to annotate their traces and easily navigate to region of interests. The bookmarks are shown in the newly added marker axis on the bottom of the time graph views. It is possible to minimize the marker axis as well as to hide marker categories.
Lost event markers in time graph views
Time graph views such as Control Flow or Resources view now highlight the durations where lost lost events occurred. .
It is possible to navigate from one marker forward and backwards in time graph views as well as it's possible to configure which marker type to include for the navigation. It is also possible to hide markers of a given type from the view menu.
API for trace specific markers
A new API is provided to define programmatically trace specific markers. This can be used, for example, to visualize time periods in the time graph views.
Resources view improvements
Display of soft IRQ names in the Resources view
The Resources view now displays the soft IRQ names together with the Soft IRQ numbers.
Execution context and state aggregation
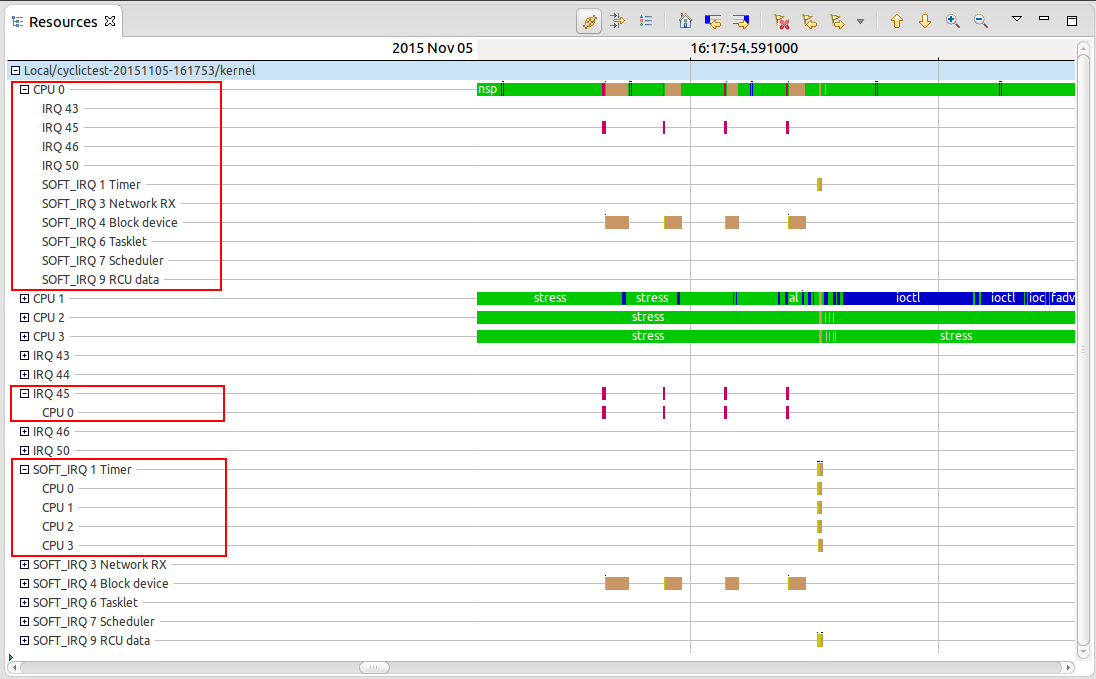
The Resources view now shows the execution contexts and adds the CPU states under the IRQ and SoftIRQ entries.
Following a single CPU across views
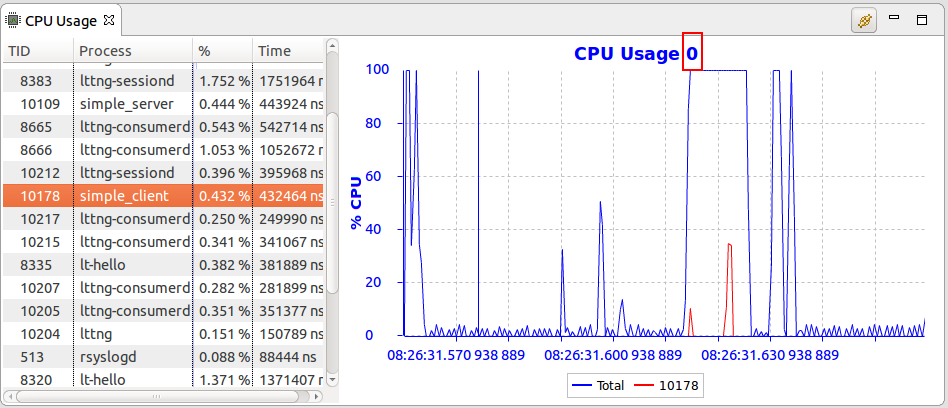
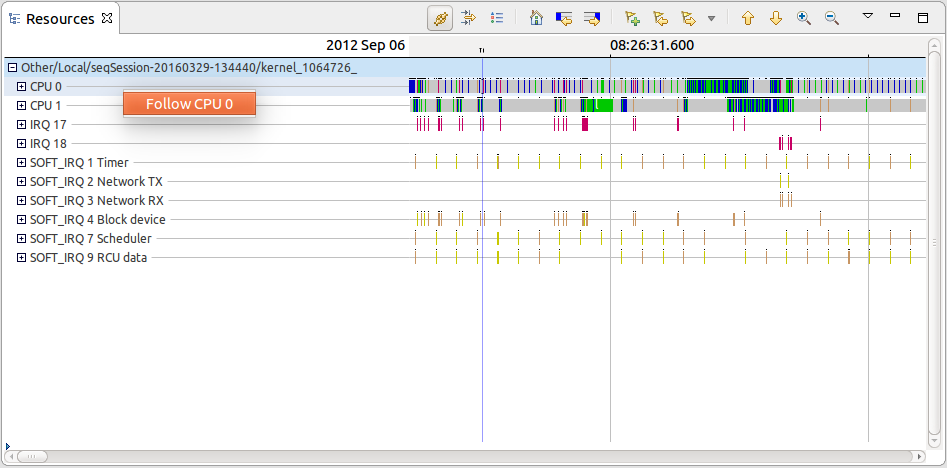
It is now possible to follow a single CPU from the Resources view using the context-sensitive menu. The CPU Usage view is the first view that uses this information to filter the CPU Usage per CPU.
Control Flow view Improvements
Support for sorting in Control Flow view
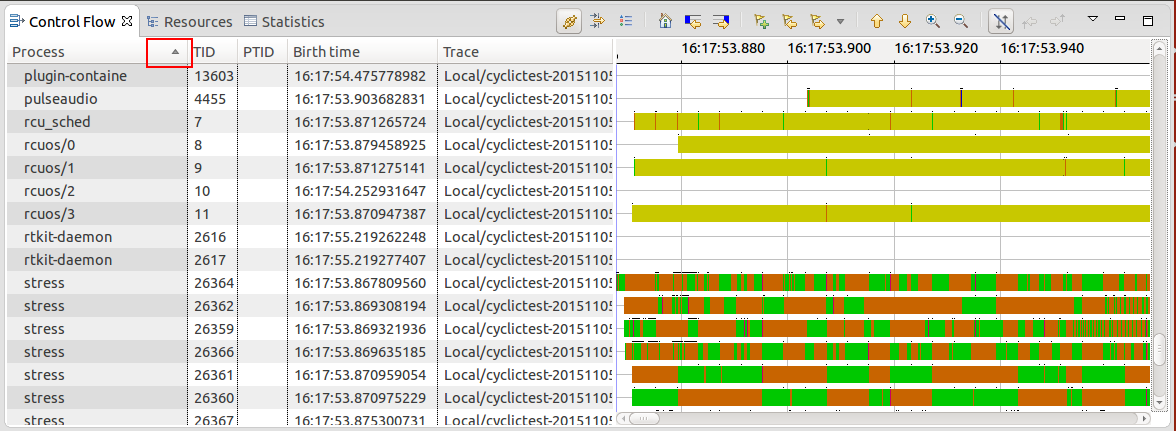
It is possible to sort the columns of the tree by clicking on the column header. Subsequent clicking will change the sort order. The hierarchy, i.e. the parent-child relationship is kept. When opening a trace for the first time, the processes are sorted by birth time. The sort order and column will be preserved when switching between open traces. Note that when opening an experiment the processes will be sorted within each trace.
Following single thread across views
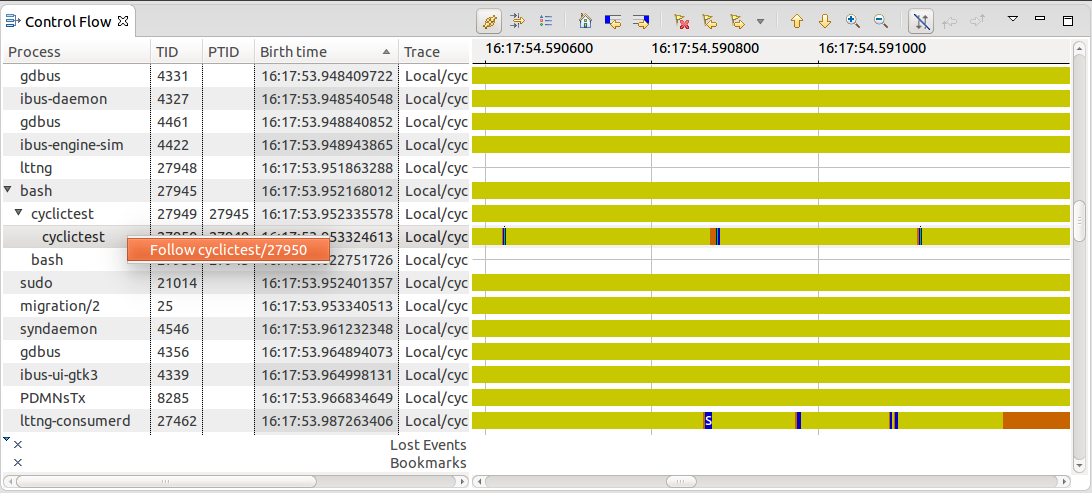
It is now possible to follow a single thread from the Control Flow view using the context-sensitive menu. The Critical Path view is the first view that uses this information to trigger its analysis for the selected thread.
Support of vertical zooming in time graph views
It is now possible to zoom vertically in all time graph views, for example Control Flow view or Resources view, using the key combination Ctrl+'+' or Ctrl+'-' or using the mouse with Shift+Ctrl+mouse wheel. The key combination Ctrl+'0' resets the vertical zoom to the default.
CPU Usage view improvements
Per CPU filtering in CPU Usage view
It is now possible to visualize the CPU usage per CPU in the view. The filtering can be triggered by using the Follow CPU menu item of context sensitive menu of the Resources view.
Kernel memory usage analysis
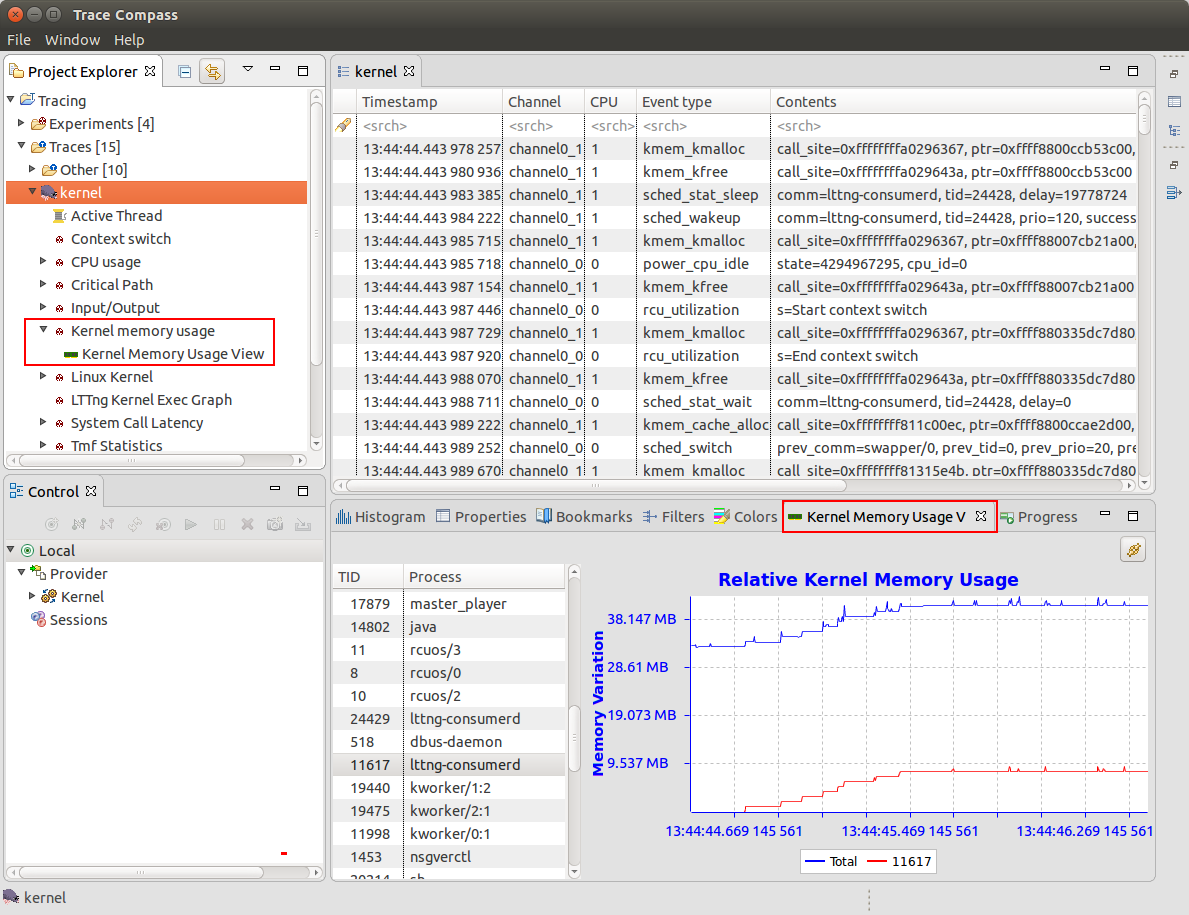
The Linux Kernel memory analysis and view have been added using LTTng Kernel traces. The Kernel Memory Usage view displays the relative Kernel memory usage over time.
Linux Input/Output analysis and views
The Linux Kernel input/output analysis have been added using LTTng Kernel traces.
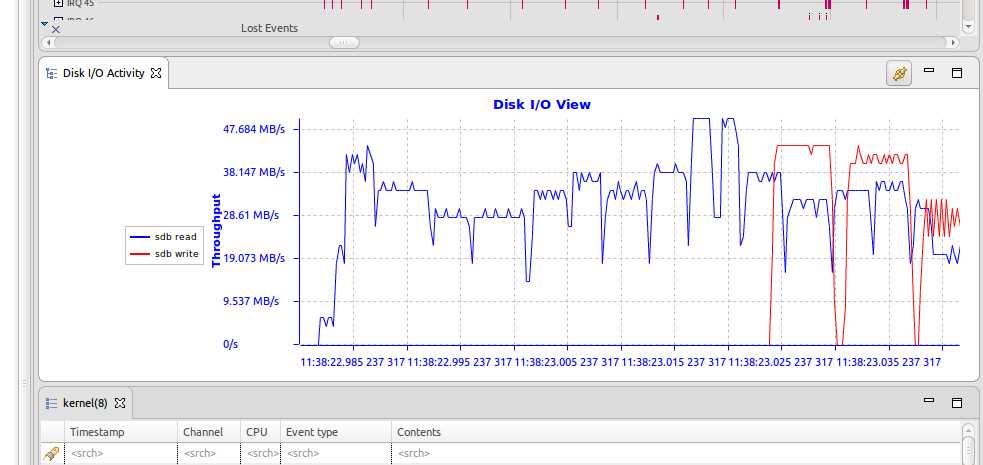
I/O Activity view
The I/O Activity view shows the disk I/O activity (throughput) over time.
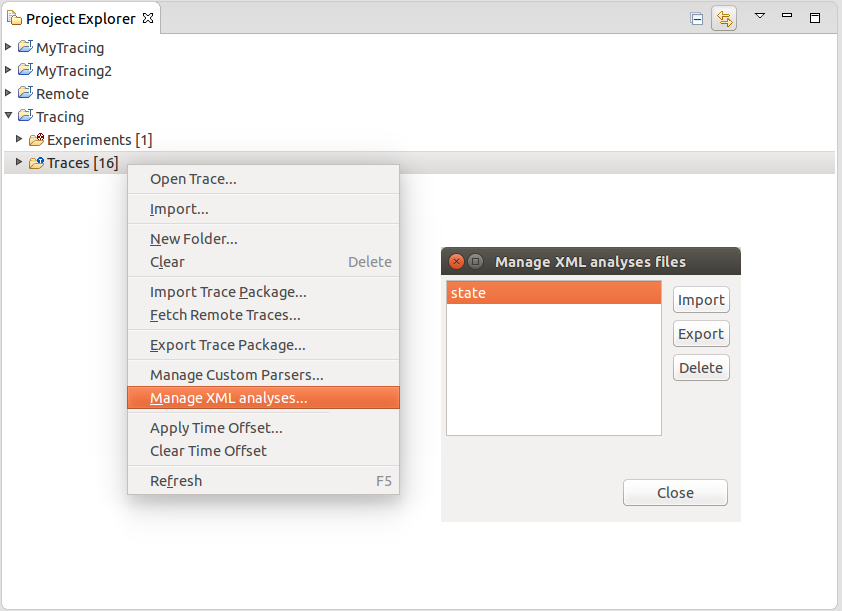
Manage XML analysis files
A dialog box has been added to manage XML analyses. This allows users to import, export and delete XML analysis files.
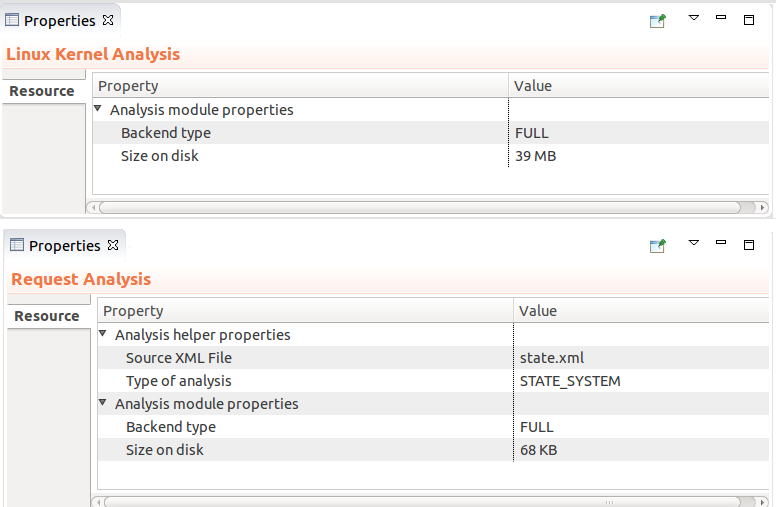
Display of analysis properties
The Properties view now displays analysis properties when selecting an analysis entry in the Project explorer.
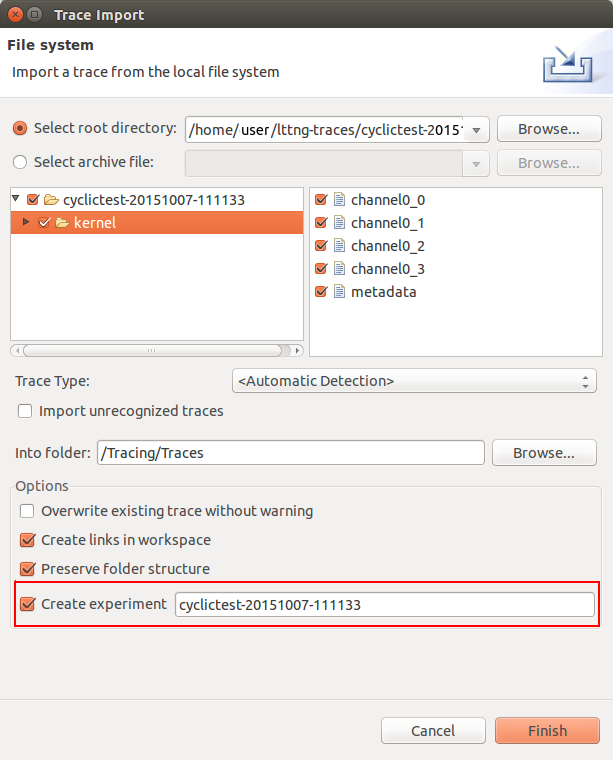
Importing traces as experiment
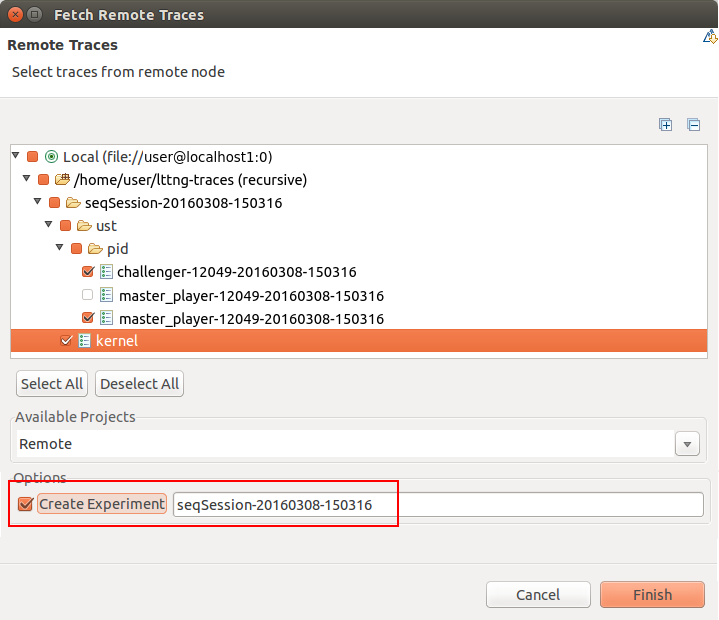
It is now possible to import traces and create an experiment with all imported traces using the Standard Import wizard.
Importing LTTng traces as experience
It is now possible to import traces and create an experiment with all imported traces using the LTTng remote import wizard.
Events Table filtering UI improvement
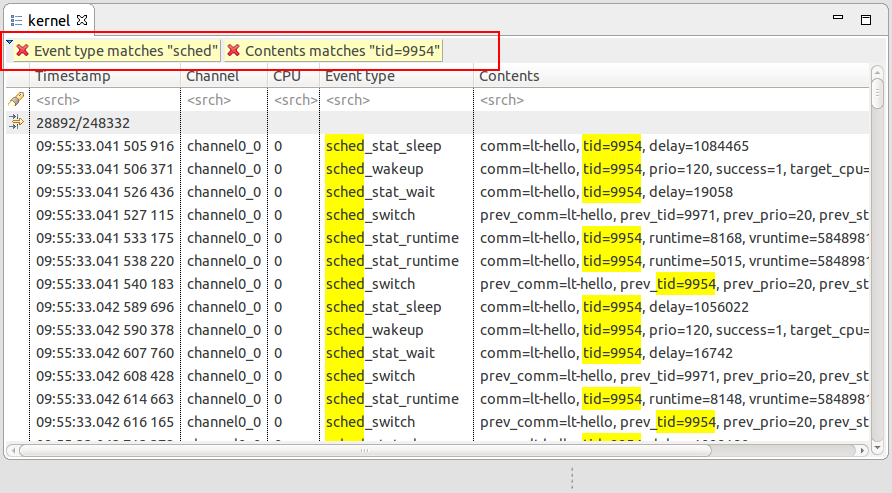
It is now possible to create a filter from the search string using the CTRL+ENTER key combination. A new collapsible header will be shown for all active filters. Multiple cumulative filters can be added at the same time.
Visualization of debug info for source code lookup coming with LTTng 2.8 traces
Symbol provider for Call stack view
An extension point has been created to add a symbol provider for the Call Stack view. With this Trace Compass extension can provide their own symbol mapping implementation.
Per CPU thread 0
The Control Flow view have been updated to model thread ID 0 per CPU.
Improve analysis requirement implementations
Analysis requirement implementation have been added for event names and fields. The Event fields implementation can be used for LTTng contexts. LTTng UST Call Stack and Kernel CPU Usage analysis have been updated for that. Now, the LTTng UST Call stack analysis is disabled when the mandatory requirement is not met.
Pie charts in Statistics view
Pie Charts have been added to the Statistics view.
LTTng Live trace reading support disabled
It was decided to disable the LTTng Live trace support because of the shortcomings documented in bug 486728. We look forward to addressing the shortcomings in the future releases in order to re-enable the feature.
Bugs fixed in this release
See Bugzilla report Bugs Fixed in Trace Compass 2.0

