Notice: This Wiki is now read only and edits are no longer possible. Please see: https://gitlab.eclipse.org/eclipsefdn/helpdesk/-/wikis/Wiki-shutdown-plan for the plan.
Trace Compass/News/NewIn20
Contents
Pie Chart in Statistics view
Pie Charts have been added to the Statistics view.
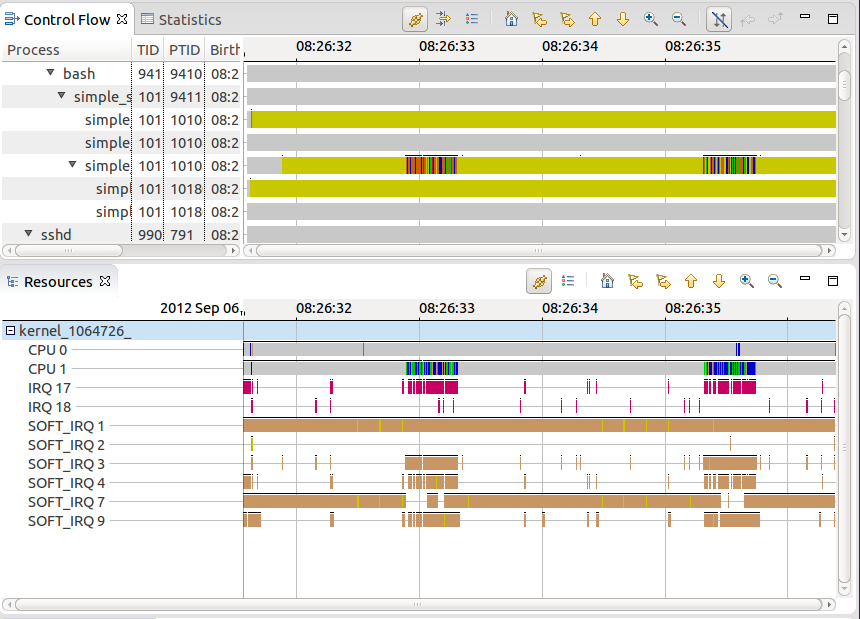
Grid lines in Time Graph views
Grid lines have been added to the time graph views such as the Control Flow view.
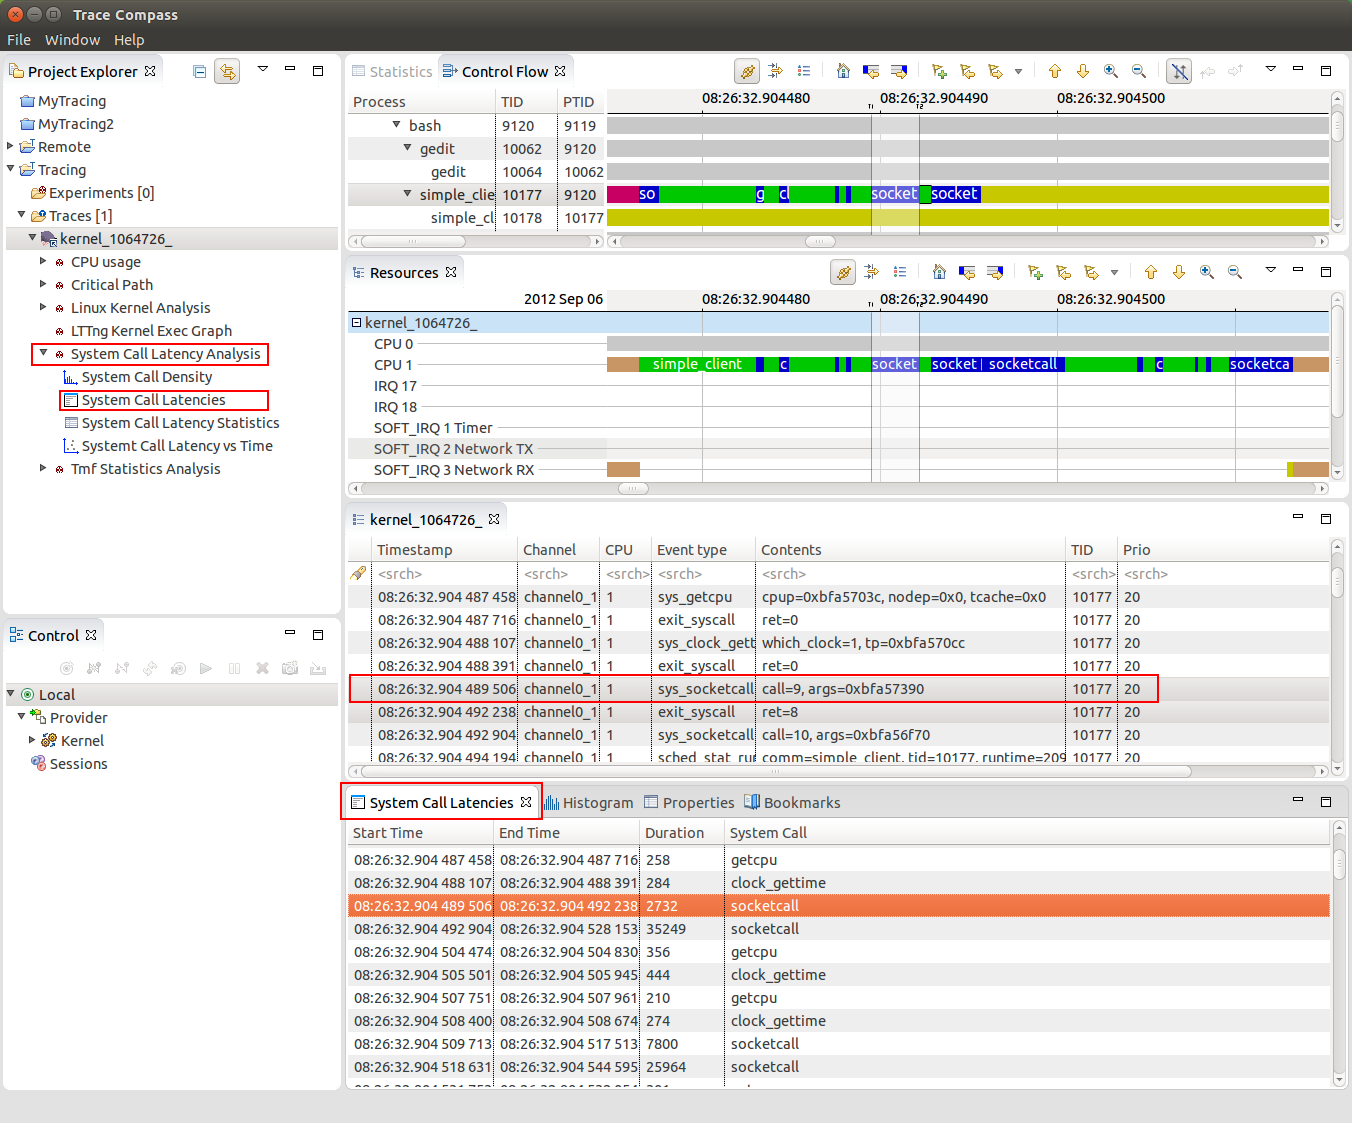
System Call Latency Analysis Table
A initial, in memory implementation of a Latency Analysis and Latency Table for analyzing system call latencies in the Linux Kernel has been added. This is a preliminary implementation and will be the base for a more generic support for Latency analyses for the Linux Kernel and for user applications.
Note that labels and procedures might change before the actual 2.0 Trace Compass release.
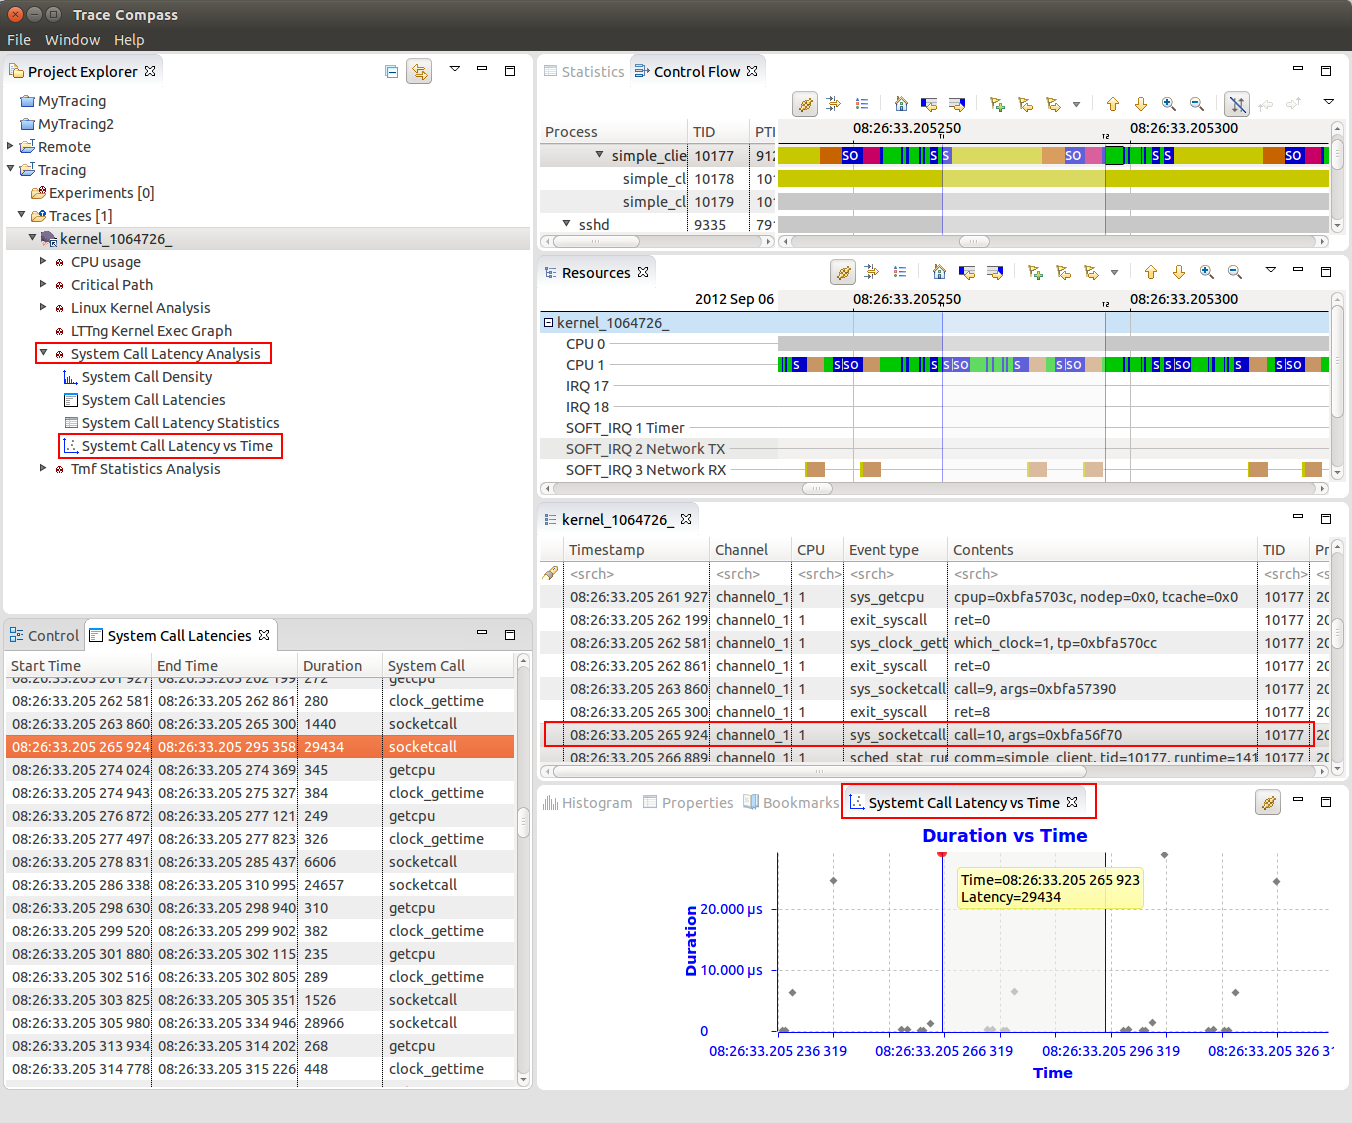
System Call Latency Analysis Scatter Graph
A new view has been added that visualizes system call latencies in the Linux Kernel over time.
Critical Flow view
A Critical Flow Analysis and view has been added to show dependency chains for a given process.
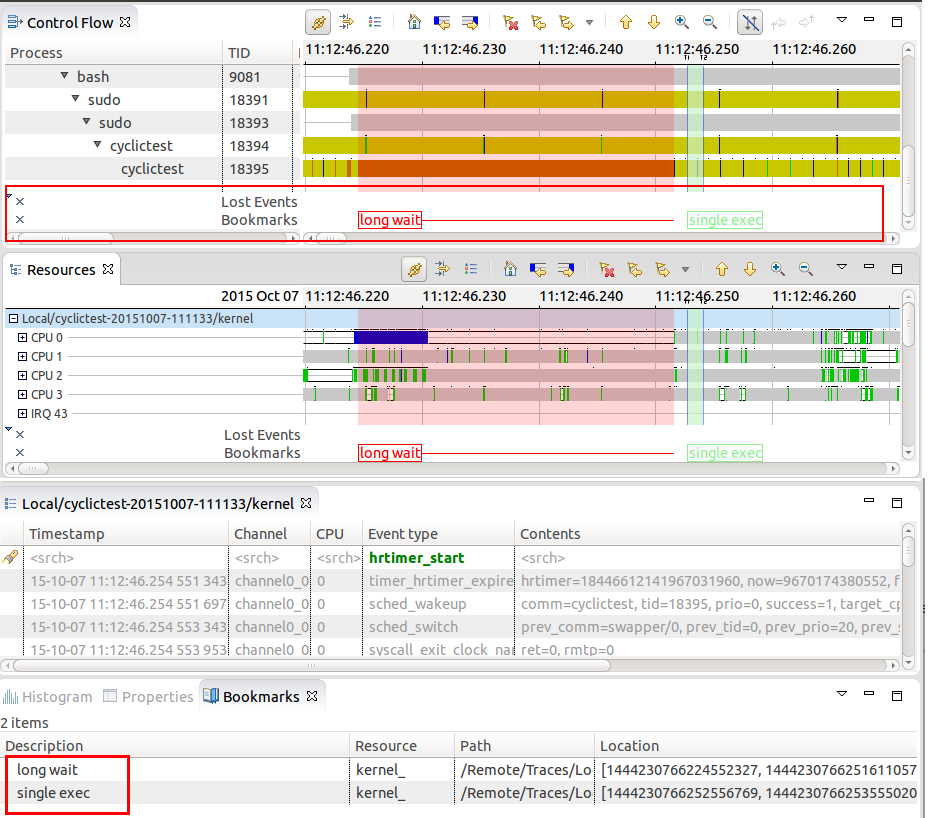
Support for user bookmarks in time graph views
It is now possible to create bookmarks in time graph view for a single or time range selection. This will allow users to annotate their traces and easily navigate to region of interests.
Display of Soft IRQ names in the Resources view
The Resources view now displays the soft IRQ names together with the Soft IRQ numbers.
Bugs fixed in this release
See Bugzilla report Bugs Fixed in Trace Compass 2.0


