Notice: this Wiki will be going read only early in 2024 and edits will no longer be possible. Please see: https://gitlab.eclipse.org/eclipsefdn/helpdesk/-/wikis/Wiki-shutdown-plan for the plan.
Difference between revisions of "STEM Map View"
| (11 intermediate revisions by 5 users not shown) | |||
| Line 1: | Line 1: | ||
[[Image:STEM TOP BAR.gif|800px]] | [[Image:STEM TOP BAR.gif|800px]] | ||
| + | |||
| + | '''[http://wiki.eclipse.org/Tutorials_for_Developers Back]''' | ||
= STEM Map View = | = STEM Map View = | ||
| − | The STEM Map View is a light weight build in viewer that allows a user to watch a simulation at run time. STEM also supports other viewers including GoogleEarth(TM) and GoogleMaps(TM). | + | The STEM Map View is a light weight build in viewer that allows a user to watch a simulation at run time. Just start a new simulation with the STEM application by selecting any scenario, right-click and select run. |
| + | STEM will automatically switch to the Run-time perspective and you should see the map view by default. STEM also supports other viewers including GoogleEarth(TM) and GoogleMaps(TM). | ||
| − | The internal Map View should | + | The internal Map View should is visible by default in the run time perspective. When a valid simulation is started, after the data is loaded into memory the map should display the polygons corresponding to the administrative divisions in the region being modeled. |
* To move or recenter the map, simply click, hold, and drag to the region of interest. | * To move or recenter the map, simply click, hold, and drag to the region of interest. | ||
| − | * To zoom in or out use the up and down arrow keys | + | * To zoom in or out, use the up and down arrow keys |
[[Image:Map1.gif|400px]] | [[Image:Map1.gif|400px]] | ||
| Line 18: | Line 21: | ||
| − | [[Image:Map2. | + | [[Image:Map2-updated.jpg|400px]] |
During a running simulation if you hover the cursor over the map an informational dialog will appear with: | During a running simulation if you hover the cursor over the map an informational dialog will appear with: | ||
| Line 24: | Line 27: | ||
* The area | * The area | ||
* Information on populations present | * Information on populations present | ||
| + | * SEIR indicators and the current percent value | ||
* Latitude and Longitude of cursor location | * Latitude and Longitude of cursor location | ||
| + | * Timestamp value | ||
| + | |||
| + | [[Image:Map5.gif|600px]] | ||
| + | |||
| + | On the lower left hand side of the map view (see above) is a combo box that allows a viewer to select different types of edges to display. By default, no edges are displayed. If the graph in a running simulation contains edges such as common borders or roads, you can select them with this combo box and see them on the map. In the example above, common borders between physically adjacent regions are shown. Do you see the places where neighboring regions are separated by a river? These have no connecting edge. Users can add new edge collections to STEM (for example bridges) and add them to a graph. In the future we will also provide an interactive graphical editor. | ||
| Line 41: | Line 50: | ||
[[Image:Map4.gif|400px]] | [[Image:Map4.gif|400px]] | ||
| + | |||
| + | = Hide options bar = | ||
| + | |||
| + | In order to increase the map area, the lower options bar can be hidden by toggling "Shop Options" in the context menu | ||
| + | |||
| + | [[Image:hide_option_bar1.png|400px]] [[Image:hide_option_bar2.png|400px]] | ||
| + | |||
| + | = View preferences = | ||
| + | |||
| + | The number of open map views, map position and zoom, view adaptions in the context menu as well as in the the options bar are automatically stored as preferences as a function of the running simulation. If this simulation is run another time, the preferences will be restored. If a view is no longer needed, it must be closed '''while the simulation is running/paused'''. Consequently the view will be removed from the preferences and no longer opens up when the simulation is started again. | ||
| + | |||
| + | [[Image:close_view_preferences.png|400px]] | ||
Revision as of 14:03, 24 September 2012
STEM Map View
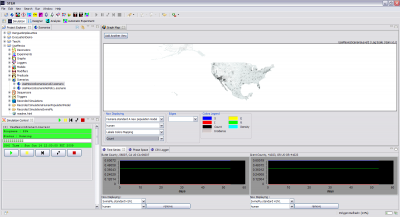
The STEM Map View is a light weight build in viewer that allows a user to watch a simulation at run time. Just start a new simulation with the STEM application by selecting any scenario, right-click and select run. STEM will automatically switch to the Run-time perspective and you should see the map view by default. STEM also supports other viewers including GoogleEarth(TM) and GoogleMaps(TM).
The internal Map View should is visible by default in the run time perspective. When a valid simulation is started, after the data is loaded into memory the map should display the polygons corresponding to the administrative divisions in the region being modeled.
- To move or recenter the map, simply click, hold, and drag to the region of interest.
- To zoom in or out, use the up and down arrow keys
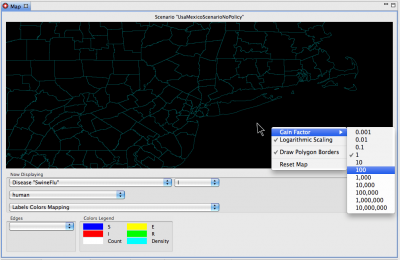
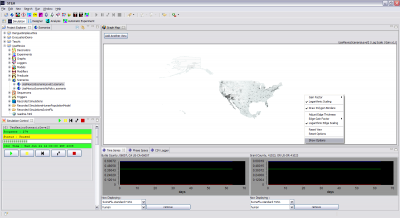
Right clicking anywhere on the map brings up a dialog that allows a user to:
- Change the gain factor or "brightness" of the display
- Toggle between logarithmic or linear mapping between (e.g.) the fraction of infectious people and color intensity
- Turn polygon borders on/off
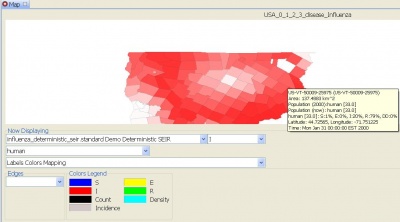
During a running simulation if you hover the cursor over the map an informational dialog will appear with:
- The name and ID of the location the cursor is over
- The area
- Information on populations present
- SEIR indicators and the current percent value
- Latitude and Longitude of cursor location
- Timestamp value
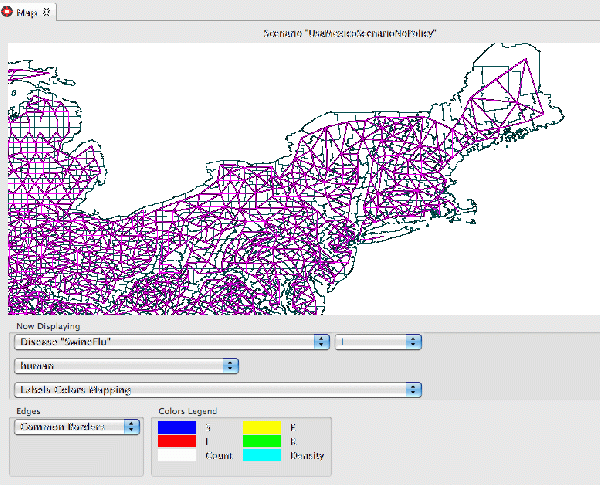
On the lower left hand side of the map view (see above) is a combo box that allows a viewer to select different types of edges to display. By default, no edges are displayed. If the graph in a running simulation contains edges such as common borders or roads, you can select them with this combo box and see them on the map. In the example above, common borders between physically adjacent regions are shown. Do you see the places where neighboring regions are separated by a river? These have no connecting edge. Users can add new edge collections to STEM (for example bridges) and add them to a graph. In the future we will also provide an interactive graphical editor.
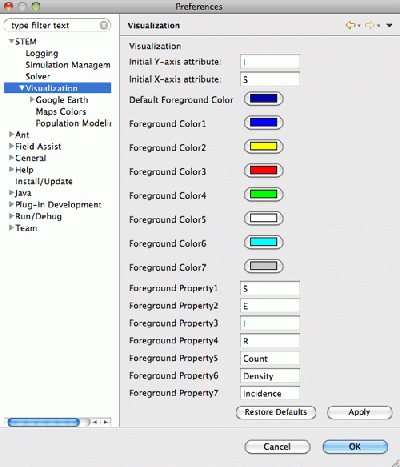
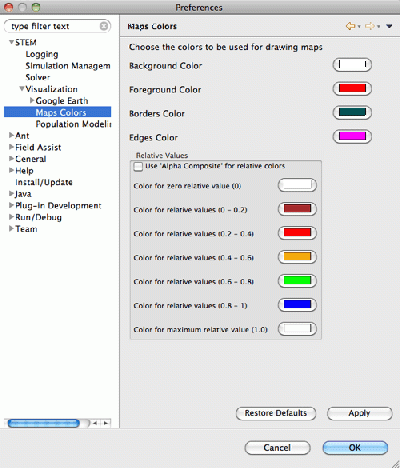
STEM also provides the ability for users to customize colors used in the system. To use this feature, when the simulation is running simply go to the top menu-bar and click
>window>preferences
This will bring up a dialog for user preferences. Expand the tags
>STEM>Visualization
The Visualization tag itself allows a user to assign a particular color to particular types of data (for example, 'I' => RED). The Map Colors tab allow customization of Map Foreground and Background colors, polygon border colors, edge Colors, etc.
Hide options bar
In order to increase the map area, the lower options bar can be hidden by toggling "Shop Options" in the context menu
View preferences
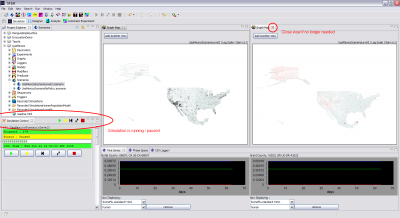
The number of open map views, map position and zoom, view adaptions in the context menu as well as in the the options bar are automatically stored as preferences as a function of the running simulation. If this simulation is run another time, the preferences will be restored. If a view is no longer needed, it must be closed while the simulation is running/paused. Consequently the view will be removed from the preferences and no longer opens up when the simulation is started again.


