Notice: this Wiki will be going read only early in 2024 and edits will no longer be possible. Please see: https://gitlab.eclipse.org/eclipsefdn/helpdesk/-/wikis/Wiki-shutdown-plan for the plan.
SMILA/Project Concepts/Performance Measurement Task Summary
Contents
Eclipse TPTP Demonstration
This demonstration contains the following: - Extending Statistical Analysis launch configuration. - Building and monitoring Sample Statistical Agent. - Building and monitoring sample JMX agent.
Adding custom Statistical Analysis launch configuration
Statistical launch configuration allows to launch particular data collection Statistical Agents. Statistical Agent is and XML message-based agent for real-time monitoring of operating systems, web servers, database servers and application servers. The following agents are provided with TPTP distribution: Windows System Performance Data (Perfmon), Linux System Perfmon Data, JBoss Application Server JMX Data, JOnAS Application Server, JMX Data, Apache/IHS server-status Data, MySQL Database Table and Variable Data Statistical launch configuration type provides interface to execute particular agent with given options. It can be extended by building the Eclipse plugin that extends org.eclipse.hyades.perfmon.PerfmonPlugin and org.eclipse.hyades.perfmon.internal_agentExtension extension point. Plugin must provide Agent specific information such as Agent name and Process executable and options that are required to launch the agent (if needed).
Sample Statistical Agent
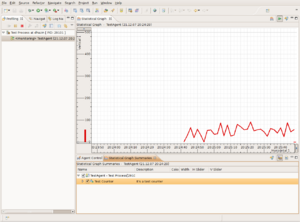
Sample Statistical Agent that has only one counter that is updated with random values is included in the demo. After agent is properly configured, it can be launched and monitored with Test Agent launch configuration:
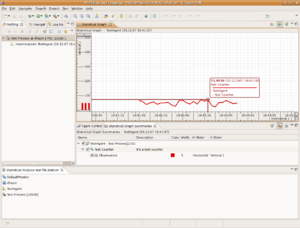
After the monitoring is stopped, profiling data can be saved and statcon file can be created. Statcon file will hold all of the settings for analysis of the collected statistical data:
Sample JMX Agent
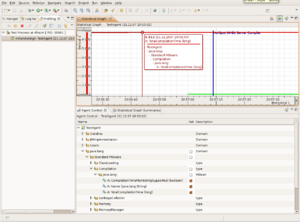
TPTP contribution includes jmxagent that can be extended to collect JMX data from any JMX server. To do this you have to implement org.eclipse.hyades.perfmon.agents.jmx.ascode.ServerCommunicationInterface and org.eclipse.hyades.perfmon.agents.jmx.ascode.ServerStatInterface interfaces and provide XML configuration for the statistical information that will be collected. TPTP distribution includes jmxagent implementations for JBoss and JOnAS Application Servers. This demonstration includes sample Tomcat JMX Data collection agent implementation. The same Test Agent Statistical launch configuration is used to start monitoring:
Software overview diagram
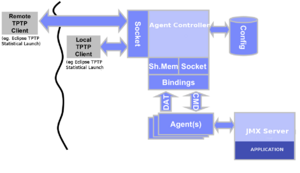
Following diagram represents the architecture of the JMX Application Data Collection with TPTP:
Further tasks overview
- Build the api framework for performance measurement based on JMX for integration in Eccenca project (similar to .NET performance counters api?). Create API Framework for Eccenca Performance Counters
- neccessary Performance Counter
- Performance Counter
- Throughput Values
- Status Notification/Values
- transaction monitoring(like arm method calls?)
- Framework should be
- reusable
- simple to use in existing Java applications
- neccessary Performance Counter
- Analyze how collected Statistical Performance Traces can be combined together. (Traces from Operationg System Performance Information and from the Eccence Performance Counters)
- Probably also create Logging Agent in addition to Statistical to create CBE Logs directly from JMX data. The monitored Values should be savable (used of CBE possible?) anad graphs information should be loadable/storable
- Documentation: Installation and Use of the API


