Notice: this Wiki will be going read only early in 2024 and edits will no longer be possible. Please see: https://gitlab.eclipse.org/eclipsefdn/helpdesk/-/wikis/Wiki-shutdown-plan for the plan.
RAP/LoadTesting
This article describes load testing / stress testing of RAP applications with Apache JMeter.
This Introduction (PDF) is very useful for getting started with JMeter.
Contents
Preparation
JMeter allows to record tests by adding a proxy to your browser and simply record the user interactions with the server.
- Start JMeter
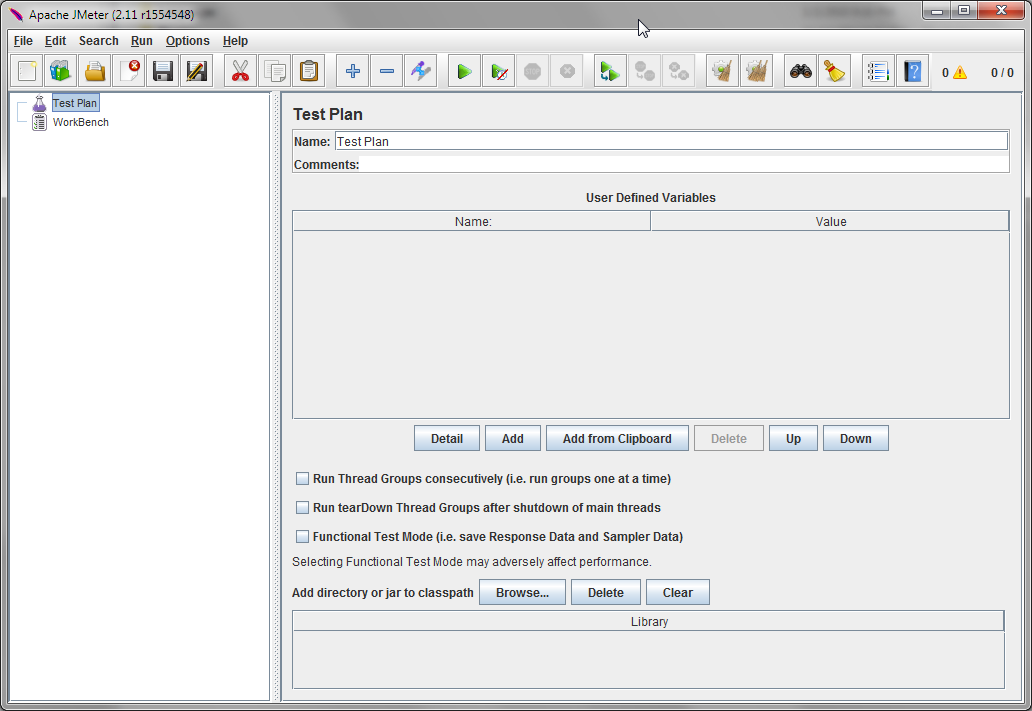
- There are two in the tree, called Test Plan and WorkBench
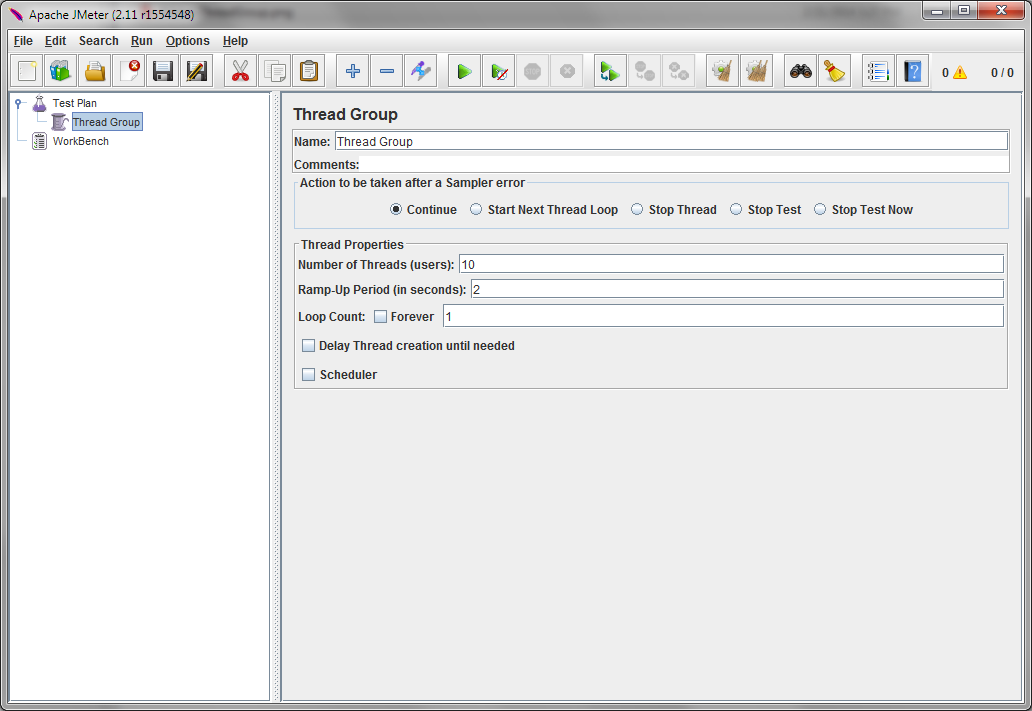
Add a Thread Group
The Thread Group will contain your recorded requests.
Select Add > Threads (Users) > Thread Group from the context menu.

Configure at least these settings:
- Number of Threads (users): this is the number of sessions that will in run in parallel
- Ramp-up Period (in second): the time it takes until the last session is started
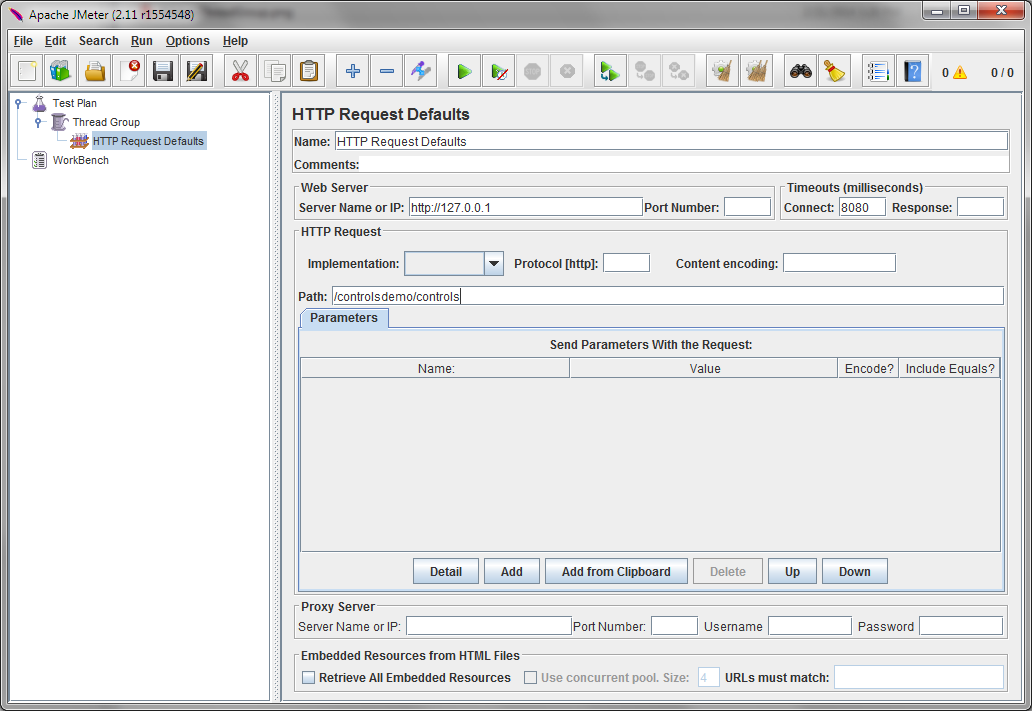
Add HTTP Request Defaults
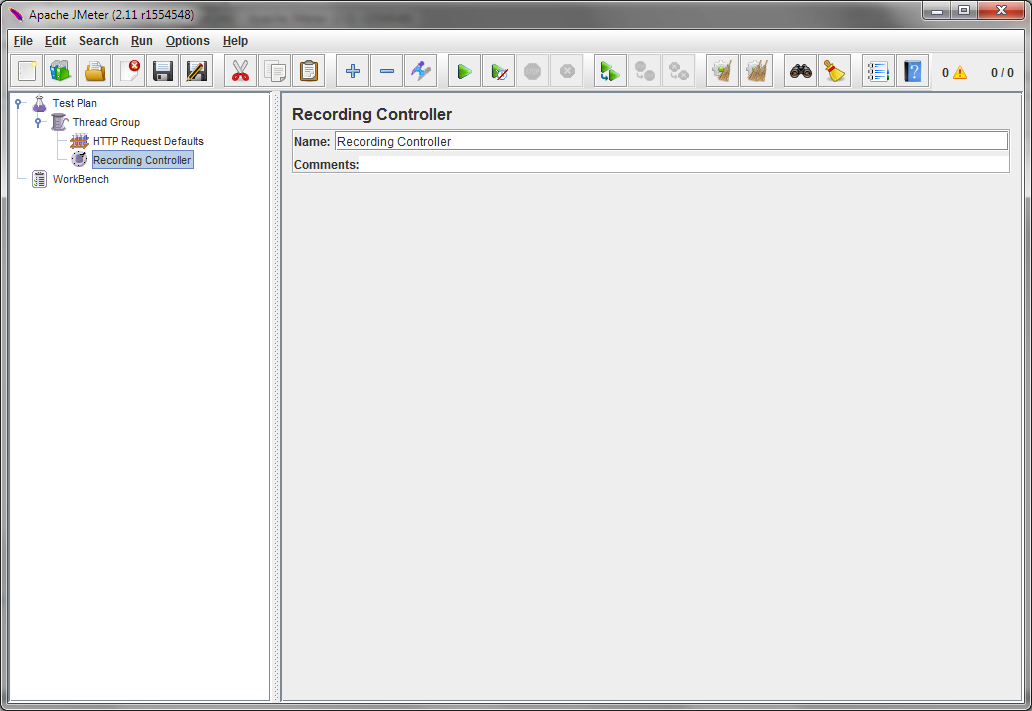
Add a Recording Controller
The recording controller will contain the recorded requests
Add > Logic Controller > Recording Controller

Add a Cookie Manager
The cookie manager is required to ensure the same HTTP session in each request. If cookies are not working every request will create a new HTTP session and the server will return an HTTP error code.
Add > Config Element > HTTP Cookie Manager
The defaults are fine.
Please note that there is a bug in JMeter 2.3.1 for clearing cookies for multiple runs / iterations; please use either JMeter 2.3.2 or later see [1]).
Add a Timer
In order to configure the request interval, you have to add a timer. Without a timer, every response is immediately followed by the next request, something a real user is not able to do.
You might want to use a random timer to add some deviation to the interval. This will lead to a better approximation of a real users behavior. We recommend
Add > Timer > Gaussian Random Timer
Add Test Script Recorder
Open the context menu on WorkBench, and select Add > Non-Test Elements > HTTP(S) Test Script Recorder (in older versions this was called HTTP Proxy Server)
This is basically a proxy server that listens on a local port (8080 by default).
You should exclude static resources from the recording.
Add a regular expression to the section URL Patterns to Exclude, e.g. .*\/rwt-resources\/.*
Recording a test
- Configure your browser to use a proxy. Use localhost and the port you configure in the test recorder (8080 by default).
- Start the proxy server: press the Start button at the bottom HTTP(S) Test Script Recorder page.
- Open a new browser tab and load the URL of your application
- Note: In RAP versions prior to 2.1, you had to re-start the browser before recording a test in order to ensure the parameter requestCounter started from zero.
Remove ServerPush Requests
After recording your test, you need to eliminate all requests with parameter servicehandler = org.eclipse.rap.serverpush. Usually, these are all requests without a cid parameter in the URL.
These requests are not answered by the server and will lead to blocking.
Running a test
Once the test plan is configured and session is recorded, you can start the test by pressing the green Start button in the toolbar.
In the top right corner, you can observe the number of parallel sessions that are currently running.
Checking the Results
To ensure that your recording is OK, you may want to start the test with only ONE session (configured in the Thread Group).
Save Responses to Files
By adding this element to your test plan you can ensure that the responses contain real JSON (not just errors). The first response will be HTML, all other responses JSON.
Add > Listener > Safe Responses to a File
Note that the target directory has to be present, it will not be created by JMeter.
If you run the recording twice, the second pass should lead to the same pattern of responses as the first one.
Configuration and Tuning Tips
- Run JMeter and the server on different machines. JMeter causes significant CPU load as well.
- Provide your application with enough heap. This depends on the number of active sessions and the memory consumption per session of your application.
- Choose an appropriate garbage collection strategy. We've found -XX:+UseConcMarkSweepGC to work best (on multi-core machines). The default garbage collector may lead to longer GC periods and can delay some responses drastically.
- Start the JVM in server mode (-server)
- If you use Tomcat, this servlet http://yourserver/manager/status/all provides interesting information
- When running JMeter with many worker threads, you must increase it's heap size. It is advisable to start with a large initial heap size, to avoid delays resulting from additional heap allocation. Refer to the HEAP parameter in the jmeter script.
- Running JMeter with a GUI could slow it down. You can run JMeter in headless mode, using the command below. This runs testplan.jmx and saves the results to result.jtl. The result file can be opened with jmeter after the test run is finished. A large result file takes some time and memory to open - be patient and increase the heap. Warning: interrupting a test run in progress, will create an incomplete result file that cannot be opened!
./jmeter -n -t /home/elias/testplan.jmx -l /tmp/result.jtl
URL rewriting instead of cookies
From [2]:
I was able to run the test with the url rewriting. In JMeter there is something called regular expression extracter. I used this to extract the jsessionid from the first response from the server and then pass the same id in the all the other requests.


