Notice: this Wiki will be going read only early in 2024 and edits will no longer be possible. Please see: https://gitlab.eclipse.org/eclipsefdn/helpdesk/-/wikis/Wiki-shutdown-plan for the plan.
Difference between revisions of "RAP/LoadTesting"
| Line 8: | Line 8: | ||
* Start JMeter | * Start JMeter | ||
| − | * There are two in the tree, called | + | * There are two in the tree, called ''Test Plan'' and ''WorkBench'' |
| − | * Open the context menu on | + | * Add a thread group to the ''Test Plan''. |
| + | |||
| + | === Add a Thread Group === | ||
| + | |||
| + | The Thread Group will contain your recorded requests. | ||
| + | |||
| + | Select ''Add > Threads (Users) > Thread Group'' from the context menu. | ||
| + | |||
| + | Configure at least these settings: | ||
| + | * Number of Threads (users): this is the number of sessions that will in run in parallel | ||
| + | * Ramp-up Period (in second): the time it takes until the last session is started | ||
| + | |||
| + | === Add HTTP Request Defaults === | ||
| + | |||
| + | === Add a recording controller === | ||
| + | |||
| + | The recording controller will contain the recorded requests | ||
| + | |||
| + | ''Add > Logic Controller > Recording Controller'' | ||
| + | |||
| + | === Add a Cookie Manager === | ||
| + | |||
| + | The cookie manager is required to ensure the same HttpSession in each request. | ||
| + | |||
| + | ''Add > Config Element > HTTP Cookie Manager'' | ||
| + | |||
| + | The defaults are fine. | ||
| + | |||
| + | === Add a Timer === | ||
| + | |||
| + | In order to configure the request interval, you have to add a timer. You might want to use a random timer to add some deviation to the interval. We recommend | ||
| + | |||
| + | ''Add > Timer > Gaussian Random Timer'' | ||
| + | |||
| + | * Open the context menu on ''WorkBench'', and select ''Add > Non-Test Elements > HTTP(S) Test Script Recorder'' (in older versions this was called ''HTTP Proxy Server'') | ||
This is basically a proxy server that listens on a local port (8080 by default). | This is basically a proxy server that listens on a local port (8080 by default). | ||
You should exclude static resources from the recording. | You should exclude static resources from the recording. | ||
| − | Add a regular expression to the section | + | Add a regular expression to the section ''URL Patterns to Exclude'', e.g. <code>.*\/rwt-resources\/.*</code> |
== Recording a test == | == Recording a test == | ||
| − | + | * Configure your browser to use a proxy. Use ''localhost'' and the port you configure in the test recorder (8080 by default). | |
| − | + | * Start the proxy server: press the ''Start'' button at the bottom ''HTTP(S) Test Script Recorder'' page. | |
| − | * | + | * Open a new browser tab and load the URL of your application |
| − | + | ||
| − | * | + | * Note: In RAP versions prior to 2.1, you had to re-start the browser before recording a test in order to ensure the parameter ''requestCounter'' started from zero. |
| − | + | ||
| − | + | === Remove ServerPush Requests === | |
| − | + | ||
| − | + | After recording your test, you need to eliminate all requests with parameter ''servicehandler'' = ''org.eclipse.rap.serverpush''. Usually, these are all requests without a ''cid'' parameter in the URL. | |
| − | + | ||
| − | + | These requests are not answered by the server and will lead to blocking. | |
| + | |||
| + | == Running a test == | ||
| − | |||
* When running the tests with multiple threads you need to include an HTTP Cookie Manager (Please note that there is a bug in JMeter 2.3.1 for clearing cookies for multiple runs / iterations; please use either JMeter 2.3.0 or 2.3.2 see [http://markmail.org/message/bis6om3wnpqtqin5]) | * When running the tests with multiple threads you need to include an HTTP Cookie Manager (Please note that there is a bug in JMeter 2.3.1 for clearing cookies for multiple runs / iterations; please use either JMeter 2.3.0 or 2.3.2 see [http://markmail.org/message/bis6om3wnpqtqin5]) | ||
Revision as of 10:13, 20 February 2014
This article describes load testing / stress testing of RAP applications with Apache JMeter.
This Introduction (PDF) is very useful for getting started with JMeter.
Contents
Preparation
JMeter allows to record tests by adding a proxy to your browser and simply record the user interactions with the server.
- Start JMeter
- There are two in the tree, called Test Plan and WorkBench
- Add a thread group to the Test Plan.
Add a Thread Group
The Thread Group will contain your recorded requests.
Select Add > Threads (Users) > Thread Group from the context menu.
Configure at least these settings:
- Number of Threads (users): this is the number of sessions that will in run in parallel
- Ramp-up Period (in second): the time it takes until the last session is started
Add HTTP Request Defaults
Add a recording controller
The recording controller will contain the recorded requests
Add > Logic Controller > Recording Controller
Add a Cookie Manager
The cookie manager is required to ensure the same HttpSession in each request.
Add > Config Element > HTTP Cookie Manager
The defaults are fine.
Add a Timer
In order to configure the request interval, you have to add a timer. You might want to use a random timer to add some deviation to the interval. We recommend
Add > Timer > Gaussian Random Timer
- Open the context menu on WorkBench, and select Add > Non-Test Elements > HTTP(S) Test Script Recorder (in older versions this was called HTTP Proxy Server)
This is basically a proxy server that listens on a local port (8080 by default).
You should exclude static resources from the recording.
Add a regular expression to the section URL Patterns to Exclude, e.g. .*\/rwt-resources\/.*
Recording a test
- Configure your browser to use a proxy. Use localhost and the port you configure in the test recorder (8080 by default).
- Start the proxy server: press the Start button at the bottom HTTP(S) Test Script Recorder page.
- Open a new browser tab and load the URL of your application
- Note: In RAP versions prior to 2.1, you had to re-start the browser before recording a test in order to ensure the parameter requestCounter started from zero.
Remove ServerPush Requests
After recording your test, you need to eliminate all requests with parameter servicehandler = org.eclipse.rap.serverpush. Usually, these are all requests without a cid parameter in the URL.
These requests are not answered by the server and will lead to blocking.
Running a test
- When running the tests with multiple threads you need to include an HTTP Cookie Manager (Please note that there is a bug in JMeter 2.3.1 for clearing cookies for multiple runs / iterations; please use either JMeter 2.3.0 or 2.3.2 see [1])
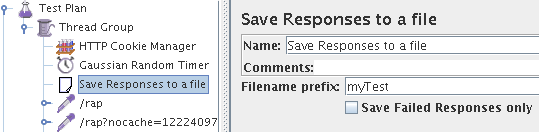
This is how the test plan should look like:

If cookies are not working every request will create a new session, this is not what we want to test (and leads to massive server load).
Also note the Gaussian Timer that has been added. A timer adds wait time between the requests, leading to a better approximation of a real users behaviour. If you don't add a timer you are putting a much higher load on the server, as every response is immediately followed by the next request, something a real user is not able to do.
Generating requestCounter
To make sure that we don't get the erros related to a wrong 'requestCounter' value, add the following
- A 'Response Assertion in the Thread Group for 'Main sample and sub-samples' with a Pattern Matching Rule 'contains not'
Multiple browser-instances
To generate the 'requestCounter' parameter when replaying the request you have to add the following:
- A 'User Defined Variable' in the Thread Group with the name 'request_counter' and the value '0'
- A 'Bean Shell Pre-Processor' in the Thread Group containing the following script
 var sampler = ctx.getCurrentSampler();
 if(sampler.getPath().contains("nocache")){
   var doCount = vars.get("startCounter");
   if(doCount == "OK") {
     oldCounter = Integer.parseInt(vars.get("request_counter"));
     sampler.addArgument("requestCounter", Integer.toString(oldCounter));
     newCounter = oldCounter + 1;
     vars.put("request_counter",Integer.toString(newCounter));
   }
 }
- Underneath the first request with a ?nocache directive add a 'Bean Shell PostProcessor' with the following script
vars.put("startCounter", "OK");
This is what it does:
- After the first post we set the flag 'startCounter' to 'OK' to start incrementing the requestCounter with every subsequent request.
- The Pre-Processor is called before every request. If it contains the ?nocache directive it is a POST and must contain the 'requestCounter' parameter
- The parameter ist added to the request with the sampler.addArgument call.
- The user variable is incremented for the next request
Check Playback
This is how we check if the playback of the session is working.
- Start testing with only ONE session and two loops (configured in the Thread Group)
- Add a "Save Responses to a file" listener
-
- Examine the response files, the patter should look like this
- The first response is an HTML file (expanded size is approxametly one megabyte, the compressed size that is going over the wire is about 200KB)
- The second response should be a .js or .javascript file with a size above 20KB, it contains the instructions for setting up the first user interface
- You may have responses that are of type "unknown" as responses to the UICallBack requests (can also appear as .js), in our example the third response
- The fourth response and all consecutive "non-UICallback" requests should have a response that contains some JavaScript instructions that do set some properties (e.g. w.setSpace or w.setItems in the example below)

org.eclipse.swt.EventUtil.suspendEventHandling();
var req = org.eclipse.swt.Request.getInstance();req.setRequestCounter( "7" );
var wm = org.eclipse.swt.WidgetManager.getInstance();
var w = wm.findWidgetById( "w44" );
w.setSpace( 0, 796, 19, 20 );
var w = wm.findWidgetById( "w81" );
w.setItems( [ "View I / Locate in browser view", "View I / Root", "View I / null"]);
qx.ui.core.Widget.flushGlobalQueues();
org.eclipse.swt.EventUtil.resumeEventHandling();
- if all responses contain only code like this, the test is not properly executed
org.eclipse.swt.Request.getInstance().send();
org.eclipse.swt.Request.getInstance().enableUICallBack( "rap",
"custom_service_handler",
"org.eclipse.rwt.internal.lifecycle.UICallBackServiceHandler" );
- The second pass of the the test should lead to the EXACT same pattern of responses as the first one
- If this is not the case you need to turn on "Custom IDs" for the RAP widgets, an instruction will follow shortly
- After you verified the result pattern you should save only failed responses and turn up the volume of your load tests.
Configuration and Tuning Tips
- Tomcat / JVM
- For best results monitor the memory consumption of your application. Turn on the garbage collector statistics to find out what is going on. If your application is leaking memory, performance will decrease very quickly!
- Provide your application with enough heap. This depends on the number of active sessions and the memory consumption per session of your application. For realistic results, use an appropriate session time out setting
- Choose an appropriate garbage collection strategy. We've found -XX:+UseConcMarkSweepGC to work best (on dual-core machines)
- Start the JVM in server mode (-server)
- RAP can ensure that widget id's are generated in the exact same way from session to session. This comes at a slight performance cost. It is useful for load testing because, if id's are different between sessions, this could result in a server response that does not match what the test expects. To activate the 'repeatable id numbering scheme', download the org.eclipse.rap.widgetidgenerator plug-in from the RAP Sandbox (/cvsroot/rt/org.eclipse.rap/sandbox/org.eclipse.rap.widgetidgenerator) and deploy it with your application. Use -Dorg.eclipse.rwt.enableUITests=true in tomcat's launch arguments
- If you use tomcat, this servlet http://yourserver/manager/status/all provides interesting information
- Obviously - don't run JMeter and the Tomcat on the same machine
- JMeter
- When running JMeter with many worker threads, you must increase it's heap size. It is advisable to start with a large initial heap size, to avoid delays resulting from additional heap allocation. Refer to the HEAP parameter in the jmeter / jmeter.bat scripts
- Running JMeter with a GUI could slow it down, since updating the GUI takes away CPU cycles. You can run jMeter without a UI, using the commandline below. It starts jmeter without a UI, runs testplan.jmx and saves the results to result.jtl. The result file can be opened with jmeter after the test run is finished. A large result file takes some time and memory to open - be patient and increase the heap. Warning: interrupting a test run in progress, will create an incomplete result file that cannot be opened!
./jmeter -n -t /home/elias/testplan.jmx -l /tmp/result.jtl
URL rewriting instead of cookies
From [2]:
I was able to run the test with the url rewriting. In JMeter there is something called regular expression extracter. I used this to extract the jsessionid from the first response from the server and then pass the same id in the all the other requests.
Troubleshooting
- Multiple Browser instances
- Problem: The only response data you get looks like this:
qx.core.Init.getInstance().getApplication().reload( "Multiple browser-instances or
browser-tabs per session are not\nsupported. You may click OK for restarting the session." )
- Solution: You likely didn't get a new session on recording but rather reused an old one. This reflects in the parameter requestCounter that is sent with each HTTP request. When recording, instead of reloading the application in an existing browser tab you need to load the page in a new browser tab or window.
- Follow the advices in the Recording section to be able to generate a fresh requestCounter value for each request