Notice: This Wiki is now read only and edits are no longer possible. Please see: https://gitlab.eclipse.org/eclipsefdn/helpdesk/-/wikis/Wiki-shutdown-plan for the plan.
Difference between revisions of "Profiling with TPTP - plug-in development"
(→Profile a plug-in project) |
|||
| Line 3: | Line 3: | ||
== Profile a plug-in project == | == Profile a plug-in project == | ||
* 1. Select a plug-in project and select '''Profile As...''' > '''Eclipse Application'''. | * 1. Select a plug-in project and select '''Profile As...''' > '''Eclipse Application'''. | ||
| − | ::[[ | + | ::[[Image:Pluginscreen1.jpg]] |
* 2. In profile configuration dialog, under '''Monitor''' tab, select '''Java Profiling''' agent, and select '''Edit Option'''. | * 2. In profile configuration dialog, under '''Monitor''' tab, select '''Java Profiling''' agent, and select '''Edit Option'''. | ||
| + | ::[[Image:Pluginscreen2.jpg]] | ||
* 3. In '''Filter''' page, add a new filter. | * 3. In '''Filter''' page, add a new filter. | ||
| + | ::[[Image:Pluginscreen3.jpg]] | ||
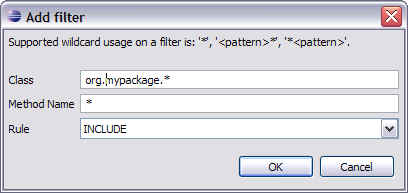
* 4. Input a new filter that include your plug-in packages. eg., | * 4. Input a new filter that include your plug-in packages. eg., | ||
:: org.mysample* * INCLUDE | :: org.mysample* * INCLUDE | ||
| + | ::[[Image:Pluginscreen4.jpg]] | ||
* 5. Click '''Finish''' to apply filter. | * 5. Click '''Finish''' to apply filter. | ||
| + | ::[[Image:Pluginscreen5.jpg]] | ||
* 6. Click '''OK''' to start profile session. | * 6. Click '''OK''' to start profile session. | ||
| + | ::[[Image:Pluginscreen6.jpg]] | ||
* 7. Select '''Yes''' to switch to profiling perspective upon request. | * 7. Select '''Yes''' to switch to profiling perspective upon request. | ||
| + | ::[[Image:Pluginscreen7.jpg]] | ||
* 8. Profiling resources (container, host, process, agent, and analysis type) are created in profiling monitor view. | * 8. Profiling resources (container, host, process, agent, and analysis type) are created in profiling monitor view. | ||
| + | ::[[Image:Pluginscreen8.jpg]] | ||
* 9. Interact with your Run-time workbench. | * 9. Interact with your Run-time workbench. | ||
* 10.In development workbench, double-click on an analysis type to open a profiling view to show profiling data collected. | * 10.In development workbench, double-click on an analysis type to open a profiling view to show profiling data collected. | ||
| + | ::[[Image:Pluginscreen9.jpg]] | ||
* 11. | * 11. | ||
* 12. | * 12. | ||
* 13. | * 13. | ||
Revision as of 23:50, 29 July 2008
Profiling with TPTP :: plug-in development.
Profile a plug-in project
- 1. Select a plug-in project and select Profile As... > Eclipse Application.

- 2. In profile configuration dialog, under Monitor tab, select Java Profiling agent, and select Edit Option.

- 3. In Filter page, add a new filter.

- 4. Input a new filter that include your plug-in packages. eg.,
- org.mysample* * INCLUDE

- 5. Click Finish to apply filter.

- 6. Click OK to start profile session.

- 7. Select Yes to switch to profiling perspective upon request.

- 8. Profiling resources (container, host, process, agent, and analysis type) are created in profiling monitor view.

- 9. Interact with your Run-time workbench.
- 10.In development workbench, double-click on an analysis type to open a profiling view to show profiling data collected.

- 11.
- 12.
- 13.