Notice: this Wiki will be going read only early in 2024 and edits will no longer be possible. Please see: https://gitlab.eclipse.org/eclipsefdn/helpdesk/-/wikis/Wiki-shutdown-plan for the plan.
PTP/designs/sdm
Contents
Overview
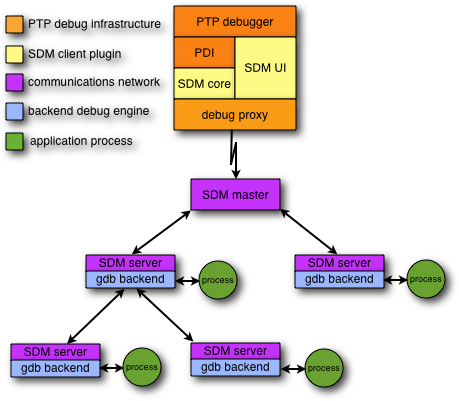
The scalable debug manager (SDM) is the component of the PTP parallel debugger that implements the debugger operations for a particular architecture, and is primarily responsible for managing communication between the Eclipse and the application being debugged. It is an implementation of the PDI in the Debug Platform.
The SDM comprises three parts:
- a client component (Eclipse plugin) that implements the PDI and provides conversion between the abstract interface and a wire protocol
- a tree-based communications network that manages communication between the client and an arbitrary number of debug servers
- a backend debug engine that controls an application process using low-level debug actions
Client
The debug client component is responsible for interfacing between the PTP debugger (in Eclipse) and the remote SDM components. It comprises the following plugins:
- org.eclipse.ptp.debug.sdm.core
- org.eclipse.ptp.debug.sdm.ui
In addition, the org.eclipse.ptp.proxy.protocol package provides a range of utility classes and methods for managing the debugger wire protocol.
The first (core) package provides an implementation of the PDI to translate between internal commands/events and the proxy wire protocol. When the debugger first starts, it calls a method in the proxy package that binds to a TCP/IP port number and waits for an incoming connection. When the connection is established, the PDI implementation command methods call methods in the proxy package to convert these to messages that will be transmitted across the socket connection. Incoming messages are in turn dispatched to the appropriate PDI event methods.
The second (UI) package, provides various user interface components that are required by Eclipse, including the SDM preference page and the dynamic component of the Debugger launch configuration tab.
Communications Network
The SDM employes a tree-based communications network in order to manage scalable communication between the front-end (Eclipse) and the processes being debugged. The tree is comprised of a master process and a number of server processes. Server processes perform two functions: passing debug commands and events between the parent and its children; and performing debug operations on an application process. Each server process computes its location in the tree (including the location of its parent and the number and location of its children) using the MPI rank provided by the runtime. When debugging an N process job, the server processes are always assumed to be ranks 0 through N-1, and the master process rank N.
Commands
Debug commands are sent from the front-end to the master process in order to perform some kind of debug action on the target application. Each debug command contains a bitmap, where each bit corresponds to one of the server processes. When a server process receives a message, it exclusive-or's this bitmap with a bitmap representing the ancestor processes for each of its children. If the result is non-zero, the message is forwarded to the child. The server also checks to see if its own rank is included in the bitmap, and if so, will perform the debug operation on the application process it is controlling.
Events
Each debug command generates a corresponding event in each the target processes specified in the command bitmap. An event also contains a bitmap representing the processes that generated the event (or an identical event.) When a server process receives an event from a child, it attempts to aggregate it with corresponding events received from other children. This aggregation is achieved by computing a hash over the body of the event message. If the hash matches that of events received from the other children, then the event is discarded and the corresponding bit is set in the event bitmap. The server will wait for events for a predetermined time before forwarding the aggregated event. This time is specified as a parameter to the debug command that generated the event.
Startup
The communications network comprising the master and server processes is an MPI program, and it launched by the PTP resource manager implementation in the same manner an application process is launched. The MPI runtime is responsible for distributing the SDM executable (if necessary) and starting the SDM processes on the parallel system. To debug an N process application, N+1 debugger processes are started (1 master and N server processes.) Once the debugger processes are started, they simply wait for messages from their parent and children. As soon as it starts, the master process informs the front-end that the debugger is ready for operation, which then proceeds as follows:
- The first command sent by the front-end is a global initialization command that supplies the name of the executable being debugged and its arguments.
- The master process broadcasts this command to all the server processes.
- Each server processes initializes the debug backend engine.
- Depending on the startup options, a breakpoint will be automatically inserted in main() and the application process started.
- The event generated as a result of the breakpoint being reached will be sent back to the front-end to indicate that initialization is complete.
GDB Backend
The current implementation use GDB as the backend debug engine. The gdb backend initialization proceeds as follows:
- The server creates pipes for stdin, stdout and stderr and forks a new process.
- The child process starts GDB.
- The parent process sends commands to GDB to load the application executable, set a breakpoint and start execution.
The GDB backend uses the GDB/MI Interface to communicate with GDB. Debugger commands are translated into the corresponding GDB/MI command syntax, and GDB/MI output is translated into debugger events.

