Notice: this Wiki will be going read only early in 2024 and edits will no longer be possible. Please see: https://gitlab.eclipse.org/eclipsefdn/helpdesk/-/wikis/Wiki-shutdown-plan for the plan.
OSEE/OTE/Users Guide/Features
Component Overview
Test Environment Service
- Provides dynamic lookup of resources
- Provides both soft real-time and simulated capabilities
- Schedules periodic execution of models (simulation components)
- Supports user configurable number of simultaneous connections
- manages the I/O and testing resources
Fully automated testing
- Automated test point tally and rollup of pass/fail determination
- Functional Testing
- Simulated Environment (eases demand on limited test station resources)
- Tests (without modification of any kind) can be run in both soft real-time and simulated environments (simultaneously, if desired)
- Real-time messaging system that supports MIL-STD-1553 MUX, serial, wire, analog and digital discretes, and publish/subscribe Data Distribution Service (DDS)
- Unit Testing
- Java
- C++
- Automated Display Testing (ADT)
Interactive Testing (automated tests with user input)
Output files
- Output file in XML
- Interactive outfiles (user can navigate the out file)
- User selectable views of outfiles: normal, debug, and flat
- Direct linking of output file lines to source test lines
- Automatic correlation of a run-time test point to the test source line that generated it
- XML output file can be automatically transformed into any format
Test Source File
- Test files are color/tool tip annotated with failures
Tightly Integrated into the Open System Engineering Environment
- Utilizes OSEE Application Framework to provide bidirectional traceability between software requirements, application code, and tests
- Leverages Java Development Toolkit (JDT) and C/C++ Development Toolkit (CDT)
- Facilitates seamless flow between test development, debugging, execution, and result analysis
- Supports the execution of multiple simultaneous batches within a single workspace
- Built-in help system extended with test manger user guide
Test Manager GUI
- Consistent, clean interface for the control of unit and functional test in the real-time and simulated environments
- Test results streamed in real-time from test service to test manager
- Remote viewing and manipulation of test service
- Single/Batch run mode
- Enable/disable running of individual scripts in the run list
- Drag and drop test files into run list
- Integrated with code debugger
- Access to test and output files from the GUI
- Lists available test services that can be used to run test files
- Real-time display of test service usage information
Message GUI
- Monitor, manipulate and record real-time messaging data
- Common user interface supporting P/S, 1553, discrete, analog, serial
- Advanced regular-expression searching
- Import/Export view lists
- Remote attachment to message service
- Playback environment
- message recording playback environment that allows for the analysis of Ethernet and MUX recordings
- supports advanced debugging of the test environment using repeatable conditions
- investigate flight recordings
Perspective
Views And Editors
The OTE Navigator is used to...

Test Manager
The Test Manager is the application that is used to run test programs in OTE (OSEE Test Environment). In OTE, tests are run which are referred to as test scripts. The Test Manager has multiple pages which are used to manage the running of these scripts. To navigate to each page, the user selects the associated tab on the bottom of the Test Manager. The Overview page can be configured with some basic overview info for the particular configuration that is extending the OTE. The Hosts page allows the user to see and connect to test environments that are used in the running of scripts. The Scripts page is the page where the scripts are actually run. The Advanced page has many configuration options related to the running of scripts. The Source page is where codes to run the scripts against can be specified.
Overview Page
The Overview page of Test Manager allows for some brief overview information related to the configuration of the Test Manager.

Hosts Page
The Hosts page of Test Manager shows the test servers that are available for the user to connect to. These test servers are the services that the test scripts code is actually run. Below is a screen shot showing an example of the Hosts tab with a test server available to be connected to before the user is connected. A user can connect a test server from this page. This table is an XViewer Table which allows the user to employ column sorting.

Below is the same example after a user named osee has connected to the test server. Notice the lightning bolt in the left column of the server entry in the table and the user's name in the User column.

Scripts Page
The Scripts page of Test Manager is the page that is the main controller of running test scripts. Below is a screen shot of the Script page with no scripts in it. There is a box near the bottom that has information related to the running of the scripts. There are also widgets along the top of the page that allow for saving and loading of script run lists, clearing out of scripts highlighted, code to run against selection, and a test server connection widget. The running and aborting widgets are there as well, though they are grayed out since the user is not connected to a test server yet.

Below, the user has put some test scripts in the Script page. The check box to the left is for determining if the script will be run when the play button (which is still grayed out). The names of the test scripts are in the Test column. The Status column shows the current status of the test script, and they all show NOT_CONNECTED when the Test Manager is not connected to a test server. The location of the test script is also shown.

In this shot, the Test Manager has now connected to a test server. The status of the scripts is shown as READY, and the test server connection widget is now shown as a lightning bolt. Also, notice that the green play button is not grayed out anymore. It can be selected to start the running of the selected test scripts.

Below, the test script run is in progress. Notice the first script is completed and there is a checkmark in the Output File column. That signifies that an output file has been created for the completed run. The user can double-click the checkmark to open the output file. The results of the run are shown in the Result column, and it even shows the results while in progress. The first script passed all 721 test point. The 2nd script is still running and has failed 1 of the 9 test points so far.

Advanced Page
The Advanced Page of the Test Manager is the page where configuration options can be set. This page can be tailored to the individual needs of the project that is employing the Test Manager. In the example shown, the term OFP is the name for the code that is being tested.

Source Page
The Source page of Test Manager allows the user to enter source code location to run against. It also contains the location to place the Description information that shows up on the Overview Page.

Message View
The Message View tool provides a listing of all messages in the currently checked out Messages.jar file. The main purpose is facilitating adding messages or message elements to the Message Watch tool, such that the trasmision of messages and values of elements can be viewed.

From the OTE Navigator View, open the Messaging folder and double click on "Open Message View". It can be launched from the OTE Navigator.

Search - Filters the messages and elements, to make it easier to locate the desired messages or elements
Messages and elements are filtered using Java regular expressions. Type in the expression, and select "Go". To remove the filter, clear the Search box and click "Go". As shown in the example above, the entire message name was entered, and the corresponding elements also remain. The example below shows using the wildcard ".*", which means any number of any characters can follow "ACFT". As shown, messages that do not match the pattern remain if they contain any elements that do match the pattern.
 |
 |
Watch - Adds the selected element or message to the Message Watch tool.
From the message watch tool, right-click on the desired message or element and choose "Watch". If a message is selected, "Watch" will add only the message to Message Watch, "Watch All" will add the message and all of its elements.
 |
 |
Message Watch
The Message Watch tool provides capability to monitor and simulate messages and element values. The Message Watch tool is coupled with the Message View tool, which is used for adding the message/elements to Message Watch.

From the OTE Navigator View, open the Messaging folder and double click on "Open Message Watch". It can be launched from the OTE Navigator as shown below, or from Message View by watching a message/element.

Adding Elements - Adds message elements to the Message Watch tool. Right-click on an existing message. From the menu, choose "Watch Element", then select either "All" or the specific message element desired. Alternatively, messages/elements can always be added using the Message View tool.

Removing Elements - Removes the message/element from the Message Watch table. Right click on the desired element or message, and choose Delete. Alternatively, select the desired item and click the single X, or to remove all items select the double X.

Set Elements - Modifies the value of an element on a Writer buffer. From a Writer Message, right click and choose "Set Value". Enter the desired value, and select "Ok".

|

|
Read vs. Write Buffer - Each message can be shown as either a "Reader" or a "Writer", that is either an output of the processor under test, or an input to the processor under test, respectively. The curren tstate is depicted as either a 'R' or a 'W' on the message icon. In the picture below, all of the messages are currently readers. Right click on a message in the Message Watch table, and choose "Reader/Writer Buffer" from the menu. Select the desired state.

Sort - Sorts the data in the Message Watch table by click on the column heading.

- Click on the first column heading desired to be sorted.
- Notice the "Sort:" line shown below the table.
- To reverse the sort order, click the column heading a 2nd time.
- To sort by multiple columns, hold the CTRL key while clicking on additional columns.
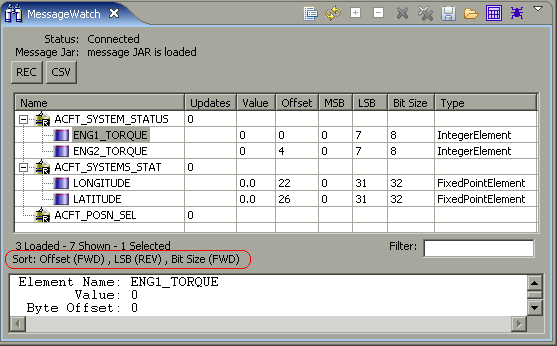
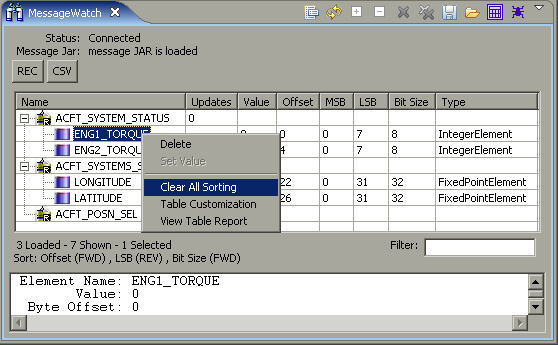
- To remove the sorting, right-click anywhere in the table and choose "Clear All Sorting"


Mux View
The mux view allows the user to monitor and simulate mux messages.