Notice: this Wiki will be going read only early in 2024 and edits will no longer be possible. Please see: https://gitlab.eclipse.org/eclipsefdn/helpdesk/-/wikis/Wiki-shutdown-plan for the plan.
Difference between revisions of "Logging Data to Files"
| Line 14: | Line 14: | ||
[[Image:Csv1.jpg|400px]] | [[Image:Csv1.jpg|400px]] | ||
| − | + | ||
| + | [[Image:Csv1.jpg|400px]][[Image:Csv2.jpg|400px]] | ||
'''2) Testing the Logger''' | '''2) Testing the Logger''' | ||
Revision as of 12:08, 7 May 2008
CSV Logger View
The current distribution of STEM provides users with the ability to output Disease State Data to a Comma Separated Variable (CSV) file. This function is enabled through a view called the CSV Logger View.
1) Loading the CSV Logger View
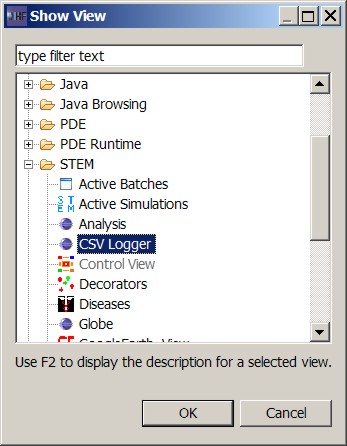
To load or activate the CSV Logger View, first launch (and run) STEM. On the top menu bar (See Figure 1) click on
>window>other...>CSV Logger
This will open a CSV Logger Tab at the bottom of your Simulation Perspective (See Figure 2). Initially the view will be blank because there are no locations being monitored.
2) Testing the Logger
To use the logger you first have to run a scenario. You can pick either your own scenario or a built in one. In the following example we use the built in scenario for the Spanish Flu in Tokyo, Japan.
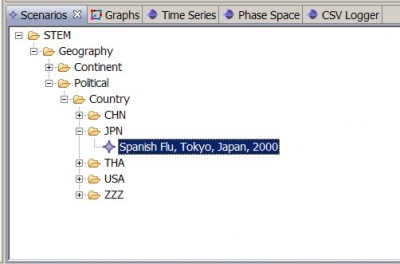
Go to the Scenarios Tab in either the Simulation or Designer Perspective and expand the Tabs
... ->STEM->Geography->Political->Country->Japan
Double click on the built in scenario Spanish Flu, Tokyo, Japan, 2000 to start it (See Figure 2).
Once you have started the scenario, click on the CSV Logger Tab. If you have never run the logger before, the logger view for the selected scenario will be blank. To activate the logger double click on locations or regions on the map of the running simulation. You choose what locations to monitor (generate logs for) by clicking on specific location. Right-clicking on a location will show you the context menu where you can enable or disable CSV Logging from the sub-menu Select Reports. This context menu determines which STEM Views will listen to map click events. This is the same selection method used in the Report Views.
As an alternative to adding new locations to your preferences for logging, you can also use the "Add All" button in the CSV Logger View (See Figure 3).. Please note that this button is dangerous as is will add a monitor for every node in a running simulation. It should only be used for small simulations. For the U.S., for example, pressing this button will create log information for over 3000 locations (over 3000 separate files).
The "Remove All" button clears the list of locations to log and resets the view (See Figure 3).
3) Remembering User Preferences
Your selections, by scenario, will be remembered in the system preferences for the CSV Logger View. The STEM CSV Logger View uses Eclipse DialogSettings to automatically remember user preferences. This feature is always enabled and begins as soon as you enable any report view. The preferences that are "remembered" are the map locations the user was most recently monitoring with one or more report views. Preferences are stored independently for each type of report so the system will allow (and remember) what the user wishes to monitor, for example, a specific set of locations for logging. The user's preferences are stored on disk in a directory:
... runtime-stem.product\.metadata\.plugins\org.eclipse.ohf.stem.util.loggers
where the directory \runtime-stem.product is located in the same parent directory as the user's STEM Eclipse workspace (for example c:\runtime-stem.product).
Preferences for the Time Series views are stored in a file:
...CSVLogger_Preferences.txt
You never need to edit this file directly. Once you have designated a set of locations to monitor for the logger, these will always be used for the corresponding scenario. In Figure 3 we show three locations in Japan that have been designated for logging. To add a new location, simply double click on the map. To remove a location simply click "remove".
NOTE: If you click on a location to monitor while a simulation is actively running, you will only generate a log beginning at the time you selected the new location. For this reason it is very important that you configure the monitored locations before the start of any important run by starting a simple "test" simulation. Once you have the CSV Logger preferences configured, stop the test simulation by clicking on the red stop button and then restart your scenario to be sure you logged data for each monitored location from the start time of the scenario.
FIGURE 3 goes here
4) Directory Location of Logged Data
The Disease State data for every location monitored is stored in a separate Comma Separated Variable file. The data directory (Figure 4) may be found under your Eclipse runtime folder as subfolder of:
... runtime-stem.product\.metadata\.plugins\org.eclipse.ohf.stem.util.loggers\csv
It is possible to run multiple scenarios in STEM, or to simultaneously run more than one instance of a given scenario. Logged data is stored in a folder with the same name as the scenario just run, but this folder is place in turn in a parent folder named by the start time of the particular scenario instance. This way, if you run the scenario more than once (for example as a batch process with some parameter changed from run to run) no data will be accidentally overwritten as each scenario will have a unique time stamp (See Figure 4).
FIGURE 4 goes here
5) CSV Logged Data Files
In Figure 5 we show the particular data files written by the logger for the three locations monitored in the example above (Figure 3). Separate CSV files (with extension .txt)are created for each location monitored. These are named using the unique node ID. A second file (runparameters.txt) is generated when running in batch mode. This will contain data about the run parameters for each scenario. Note that if you are not running in batch mode the runparameters.txt file will be empty.
FIGURE 5 goes here
Each of the data files for monitored nodes contains comma separated data on the running disease state. The specific columns in the file depend upon the type of disease model run. For example, for any standard SEIR model, the column headings will be:
iteration, time, S, I, IR, IF, R, E
If you are running the SIR model, the exposed (E) state does not exist and would not be logged. A data sample is shown in Figure 5.
FIGURE 6 goes here (need to re-number--two figure 5s in source


