Notice: This Wiki is now read only and edits are no longer possible. Please see: https://gitlab.eclipse.org/eclipsefdn/helpdesk/-/wikis/Wiki-shutdown-plan for the plan.
Linux Tools Project/Systemtap/User Guide/ide/viewingDataCharts.html
< Linux Tools Project | Systemtap/User Guide | ide
Revision as of 07:33, 10 November 2010 by Anithra.linux.vnet.ibm.com (Talk | contribs)
Viewing Data Charts
Viewing data charts from a SystemTap script is accomplished by running that script with the
Run->Run w/ Chart option. This is covered in the
Lesson 3: Running Your Script . After running a script
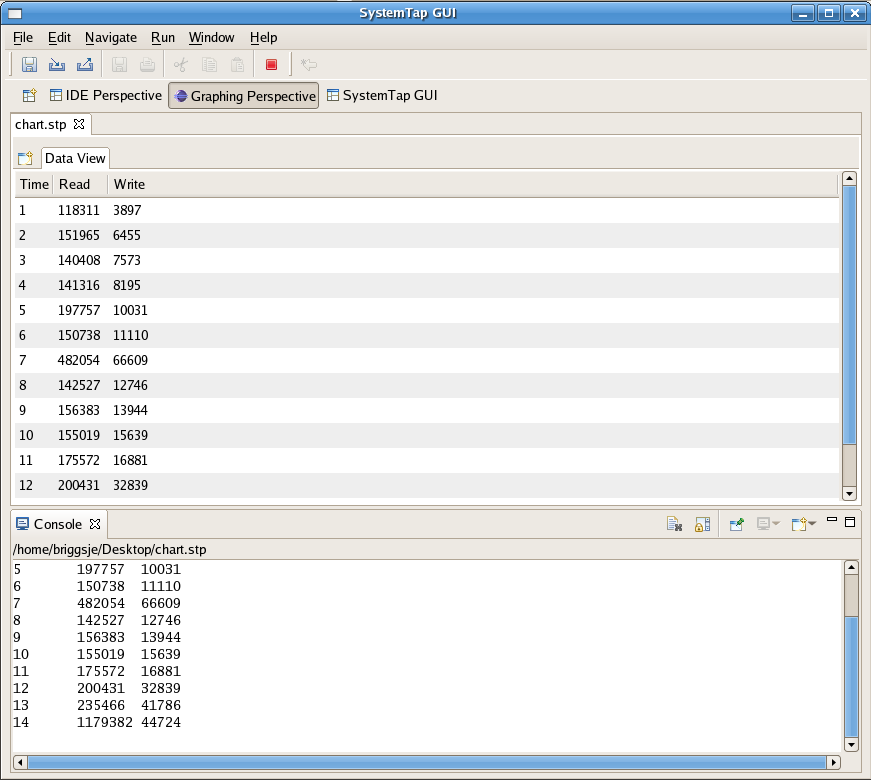
with the chart option, the user is taken into the Graphing Perspective and the Data Table is loaded by
default. The data table immediately begins populating as it recieves input back through the console from
the running SystemTap script.

