Notice: this Wiki will be going read only early in 2024 and edits will no longer be possible. Please see: https://gitlab.eclipse.org/eclipsefdn/helpdesk/-/wikis/Wiki-shutdown-plan for the plan.
Difference between revisions of "Linux Tools Project/Systemtap/User Guide"
| Line 62: | Line 62: | ||
= SystemTap IDE = | = SystemTap IDE = | ||
| + | == Getting Started == | ||
| + | === IDE Tutorial === | ||
| + | ==== Lesson 1: Getting Started ==== | ||
| − | For | + | In this tutorial we will orient you with IDE Perspective and its functions. At this point we assume |
| + | that you are able to run Systemtap GUI and are unfamiliar with how to procede. If you cannot yet start | ||
| + | the application, please refer to our [[Linux_Tools_Project/Systemtap/User_Guide/installation | Installation help page]] | ||
| + | <b>NOTE:</b> If this is the first time opening the IDE Perspective it will take a while to load as it has to | ||
| + | parse the tapsets. | ||
| + | |||
| + | The IDE Perspective's purpose is to allow the user to create, view, and edit Systemtap scripts. There are | ||
| + | other editors built in (plain text and the C editor), however, they ultimately exist to facilitate the | ||
| + | writing of Systemtap scripts. | ||
| + | |||
| + | In this lesson we will open a new Systemtap script file to familiarize ourselves with the IDE Perspective. | ||
| + | Start by opening the <u>F</u>ile menu and selecting <u>O</u>pen. A dialogue box will pop up and request the | ||
| + | location of the file you want to open. We've included a folder called "examples" right in the tar ball. You | ||
| + | may chose any of them to use; in this tutorial we will open top.stp. Go ahead and open the file. | ||
| + | |||
| + | [[Image:Editor.png]] | ||
| + | |||
| + | You'll see the file is loaded into the editor pane of Systemtap GUI. You'll also noticed different colored | ||
| + | text. Systemtap GUI supports syntax highlighting for the ease of the writer. Feel free to edit the file. | ||
| + | |||
| + | At this point proceed to [[Linux_Tools_Project/Systemtap/User_Guide/ide/lesson2.html | Lesson 2: Writing Your First Script ]] if you wish to learn how to write your | ||
| + | own script file or [[Linux_Tools_Project/Systemtap/User_Guide/ide/lesson3.html | Lesson 3: Running Your Script ]] if you wish to run this one. | ||
| + | |||
| + | [[Linux_Tools_Project/Systemtap/User_Guide/ide/IDETutorial.html | Back to Tutorial ]] | ||
| + | |||
| + | |||
| + | ==== Lesson 2: Writing Your First Script ==== | ||
| + | |||
| + | In this tutorial we will guide you through the process of writing your first Systemtap script. It is strongly recommended that you review the '''Systemtap website's tutorial''' - http://sourceware.org/systemtap/tutorial for up-to-date information on the latest version of Systemtap. | ||
| + | |||
| + | Start by selecting <u>F</u>ile-><u>N</u>ew. Specify a file name of your choosing, but be sure that it ends with an .stp extension. Click ok. Your blank script should be present in the editor pane. | ||
| + | |||
| + | [[Image:Newfile.png]] | ||
| + | |||
| + | Now type/copy the following: | ||
| + | |||
| + | <pre> | ||
| + | global read, write, start | ||
| + | |||
| + | probe begin { | ||
| + | start = gettimeofday_s() | ||
| + | } | ||
| + | probe syscall.write { | ||
| + | write += count | ||
| + | } | ||
| + | |||
| + | probe timer.ms(1000) { | ||
| + | printf("%d\t%d\t%d\n", (gettimeofday_s()-start), read, write) | ||
| + | read=0 | ||
| + | write=0 | ||
| + | } | ||
| + | </pre> | ||
| + | |||
| + | Now to demonstrate the functionality of the Probe Alias browser we will have you complete the read probe yourself. Start by opening the syscall folder in the Probe Alias browser. If you do not have any content in the browser you are experiencing a problem with Systemtap installation and should refer to our [[Linux Tools Project/Systemtap/User Guide/installation|Installation help page]]. Ensure your cursor is located at the end of the file. Now scroll down and double click the read probe alias. Systemtap GUI will insert the skeleton probe at the point at which your cursor is at, and should look similar to the following: | ||
| + | |||
| + | <pre>probe syscall.read | ||
| + | { | ||
| + | /* | ||
| + | * available variables on this probe: | ||
| + | * argstr, buf_uaddr, count, fd, name | ||
| + | */ | ||
| + | |||
| + | } | ||
| + | </pre> | ||
| + | |||
| + | Now insert the following line into the syscall.read probe: | ||
| + | <pre>read += count</pre> | ||
| + | You may remove the comment (/* ... */) if you wish. | ||
| + | |||
| + | This will count the number of bytes read and written each second and print it out. The begin probe executes first, by getting the time of day. The read and write probes increment each time the function is called. The timer probe prints the information every second. If you typed the script in manually you may have noticed that the editor provides code completion for probe aliasi. If you did not, type "syscall.". You'll see a box come up that you may use to select an item to complete your probe alias. | ||
| + | |||
| + | In [[Linux Tools Project/Systemtap/User Guide/ide/lesson3.html|Lesson 3]] you will learn how to run Systemtap scripts in the IDE Perspective. | ||
| + | |||
| + | [[Linux Tools Project/Systemtap/User Guide/ide/IDETutorial.html|Back to Tutorial Contents ]] | ||
| + | |||
| + | |||
| + | ==== Lesson 3: Running Your Script ==== | ||
| + | |||
| + | == IDE Tutorial, Lesson Three: Running Your Script == | ||
| + | |||
| + | In this lesson we will cover running your script. You may use either the example script you opened in Lesson 1 or the script you wrote in Lesson two. Select <u>R</u>un-><u>R</u>un. Enter the remote server details. You should receive output in the console similar to the following, which shows the reads and write per second. | ||
| + | |||
| + | [[Image:IDEOutput.png]] | ||
| + | |||
| + | Now we will demonstrate running Systemtap scripts with graphs. In order to run the chart example you'll need to use the code provided in [[Linux_Tools_Project/Systemtap/User_Guide/ide/lesson2.html | Lesson 2: Writing Your First Script ]];. To do this select '''<u>R</u>un->Run w/ <u>C</u>hart'''. This feature will prompt the user for the number of columns for the chart, in addition to their titles and regular expressions. The regular expressions are used to parse the console output for the script and determine the values of each column at a certain sample point. The combined regular expression is shown at the bottom of the dialogue box. | ||
| + | |||
| + | [[Image:chartbox1.png]] | ||
| + | |||
| + | For this example enter the following: | ||
| + | <pre> Columns: 3 | ||
| + | |||
| + | TITLE REGULAR EXPRESSION DELIMITER | ||
| + | Time \d+ .* \D+ | ||
| + | Read \d+ .* \D+ | ||
| + | Write \d+ .* \D+ | ||
| + | </pre> | ||
| + | |||
| + | |||
| + | The title fields simply display the associated string in the column's header. After clicking OK the script will prompt you for details regarding the Remote Server. Provide the ip address of the remote server that is running the systemtapgui Server or the Data Management Daemon. The port is by default 22462. Enter a username and password.This will give the application permissions to run your script on the remote machine. You have the option of saving your password as well, however be warned this is currently NOT encrypted so this convenience runs at a risk. The username is also used to transfer the file to the remote system using SCP. If the same machine is used as both the server and the client enter 'localhost' for the Host field. When the script is executed the application will switch into the Graphing perspective. A Data View chart is populated with live data, in addition to the output in the console. You should see a screen similar to the following: | ||
| + | |||
| + | [[Image:IDEGraphics.png]] | ||
| + | |||
| + | You will see that the data table poplulates from live data parsed from the console. Now we'll make a graph to briefly illustrate the Graphing perspective. Click the Create Graph button next to bring up the Select Chart dialogue.Select line graph. You will be prompted to select a column of the X series and Y series; select "Time" and "Write" respectively. After you click ok you should see the line graph as follows: | ||
| + | |||
| + | |||
| + | [[Image:IDEGraph.png]] | ||
| + | |||
| + | Note that the multiple series graphs (Multi-Line, Multi-Bar, and Multi-Scatter) will request two Y series, Y1 and Y2. In the case of our example, these would be "Read" and "Write". Each series will be assigned a different color value for the purposes of differentiation and will be plotted both in respect to the specified X series. | ||
| + | |||
| + | Those are the basics behind running a script in Systemtap GUI. | ||
| + | |||
| + | [[Linux_Tools_Project/Systemtap/User_Guide/ide/IDETutorial.html | Back to IDE Tutorial ]] | ||
| + | |||
| + | == Concepts == | ||
| + | === SystemTap Perspectives === | ||
| + | === STP Editor === | ||
| + | === Function Browser === | ||
| + | === Kernel Browser === | ||
| + | === Probe Alias Browser === | ||
| + | == Tasks == | ||
| + | === Creating SystemTap Scripts === | ||
| + | === Using the STP Editor === | ||
| + | === Viewing Data Charts === | ||
| + | == Reference == | ||
| + | === Views and Editors === | ||
| + | === Menus === | ||
| + | === Preferences === | ||
| + | === Frequently Asked Questions === | ||
| + | === Example SystemTap Scripts === | ||
| + | === Guide to Regular Expressions === | ||
= SystemTap Graphing = | = SystemTap Graphing = | ||
Revision as of 10:49, 9 March 2012
Contents
Overview
Welcome to the SystemTapGUI Help pages. This section is intended to provide users with information and links about the SystemTap scripting language itself, in addition to a brief introduction to SystemTap GUI's structure for new users and a brief explanation of SystemTap.
SystemTap GUI's Plugin Design
SystemTap GUI was built with a modular goal in mind, namely, to provide the application as a series of plugins so that users may obtain just the ones they need without having to use a heavy-weight application should if they didn't need to. The most common example of this is to ship the Dashboard plugin independently, allowing non-SystemTap savvy users the ability to execute modules without having to write any scripts. The application in its complete state includes three perspective, each with a specific goal:
- IDE Perspective - Contains script editor and Function, Kernel Source, and Probe Alias browsers to assist in the creation and editting of SystemTap scripts.
- Graphics Perspective - Graphs data from SystemTap scripts in the desired graph form according to a regular expression passed to interpret the data.
- Dashboard Perspective - Allows the execution of modules, which are scripts with associated metadata that open one or more graphs in a dashboard environment that update in real time.This perspective is still under development
Each perspective has full documentation associated with it and is packaged in the respective plugin.
Systemtap
SystemTap provides free software (GPL) infrastructure to simplify the gathering of information about the running Linux kernel. This assists diagnosis of a performance or functional problem. SystemTap eliminates the need for the developer to go through the tedious and disruptive instrument, recompile, install, and reboot sequence that may be otherwise required to collect data.
SystemTap provides a simple command line interface and scripting language for writing instrumentation for a live running kernel. The internal tapset library as well as the published samples can be used to aid reuse and abstraction.
Current project members include Red Hat, IBM, Intel, and Hitachi.
Configuration Tutorial
This tutorial is written to guide a new SystemTap GUI user through some basic post-installation setup in order to get the most out of the application.
Installation
If SystemTap GUI is not yet installed, or for problems in basic installation, please see the Installation help page
Kernel Source Location
In order to use the kernel source browser you'll need to point it to the kernel source initially. Do this by either selecting the Kernel Source Browser in the browser pane or by going to Window->Preferences, then going to the SystemTap->IDE->Path tab and setting the location there. This configuration detail is relevent to the IDE Perspective only.
Tutorials
If you haven't already, you will want to take the IDE and Graphing tutorials. You can find them in the Getting Started section of each perspective's help pages. These tutorial provides fundamental knowledge on graphing in SystemTap GUI.
Preferences (Optional)
Finally, you may want to set certain non-essential preferences before using SystemTap GUI regularly. Use Window->Preferences to access the Preferences page.
Of particular note are Logging->Log To, SystemTap->Environment Variables, SystemTap->Graphing->Refresh Delay, SystemTap->IDE->Editor->Syntax Coloring.
Links to SystemTap Resources
The following links contain information specific to the SystemTap scripting language.
- SystemTap website - http://sourceware.org/systemtap/
- SystemTap wiki - http://sourceware.org/systemtap/wiki
- SystemTap tutorial - http://sourceware.org/systemtap/tutorial/
- Full list of documentation - http://sourceware.org/systemtap/documentation.html
The following links are related to the SystemTap GUI project:
- SystemTap GUI Sourceforge - https://sourceforge.net/projects/stapgui/
- SystemTap GUI Homepage - http://stapgui.sourceforge.net/
SystemTap IDE
Getting Started
IDE Tutorial
Lesson 1: Getting Started
In this tutorial we will orient you with IDE Perspective and its functions. At this point we assume that you are able to run Systemtap GUI and are unfamiliar with how to procede. If you cannot yet start the application, please refer to our Installation help page NOTE: If this is the first time opening the IDE Perspective it will take a while to load as it has to parse the tapsets.
The IDE Perspective's purpose is to allow the user to create, view, and edit Systemtap scripts. There are other editors built in (plain text and the C editor), however, they ultimately exist to facilitate the writing of Systemtap scripts.
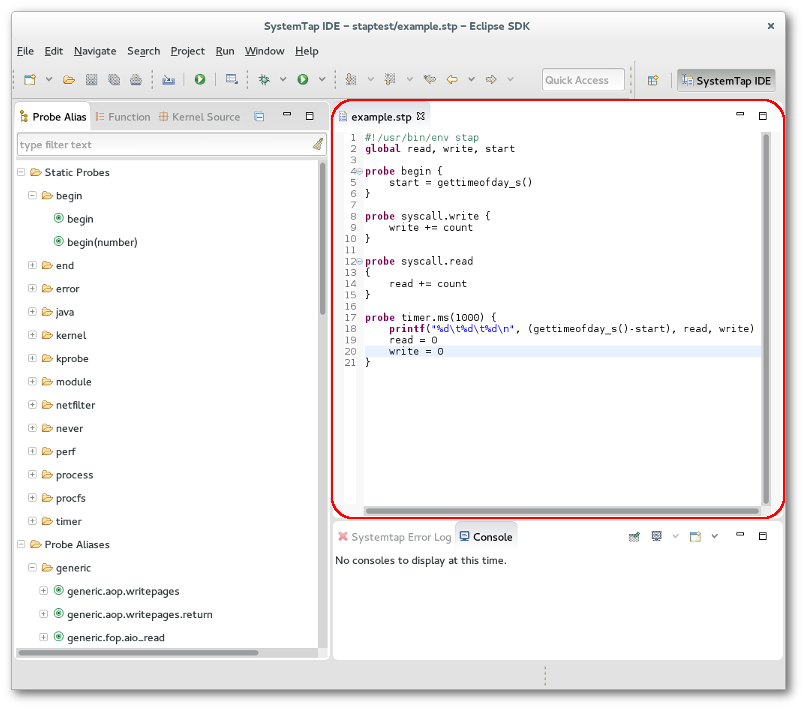
In this lesson we will open a new Systemtap script file to familiarize ourselves with the IDE Perspective. Start by opening the File menu and selecting Open. A dialogue box will pop up and request the location of the file you want to open. We've included a folder called "examples" right in the tar ball. You may chose any of them to use; in this tutorial we will open top.stp. Go ahead and open the file.
You'll see the file is loaded into the editor pane of Systemtap GUI. You'll also noticed different colored text. Systemtap GUI supports syntax highlighting for the ease of the writer. Feel free to edit the file.
At this point proceed to Lesson 2: Writing Your First Script if you wish to learn how to write your own script file or Lesson 3: Running Your Script if you wish to run this one.
Lesson 2: Writing Your First Script
In this tutorial we will guide you through the process of writing your first Systemtap script. It is strongly recommended that you review the Systemtap website's tutorial - http://sourceware.org/systemtap/tutorial for up-to-date information on the latest version of Systemtap.
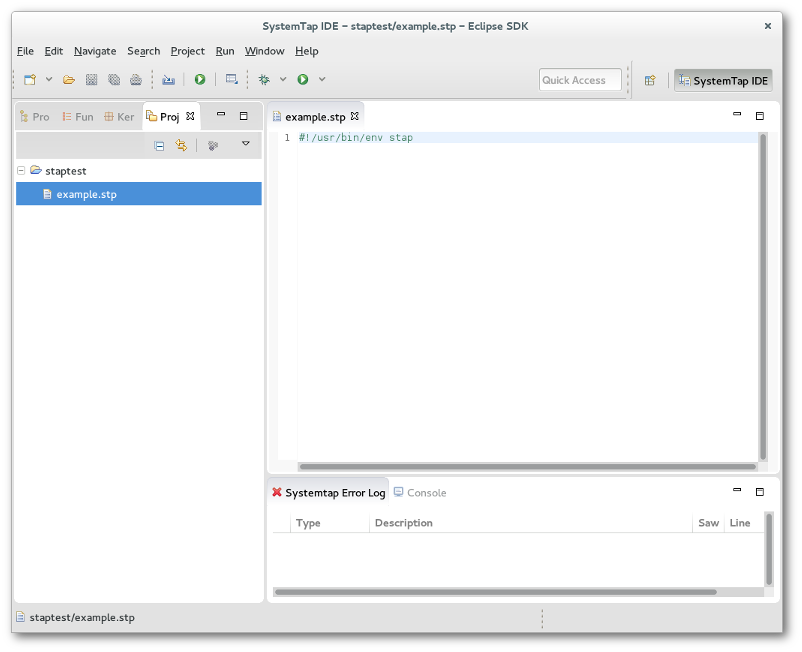
Start by selecting File->New. Specify a file name of your choosing, but be sure that it ends with an .stp extension. Click ok. Your blank script should be present in the editor pane.
Now type/copy the following:
	global read, write, start

	probe begin {
		start = gettimeofday_s()
	}
	probe syscall.write {
		write += count
	}

	probe timer.ms(1000) {
		printf("%d\t%d\t%d\n", (gettimeofday_s()-start), read, write)
		read=0
		write=0
	}
Now to demonstrate the functionality of the Probe Alias browser we will have you complete the read probe yourself. Start by opening the syscall folder in the Probe Alias browser. If you do not have any content in the browser you are experiencing a problem with Systemtap installation and should refer to our Installation help page. Ensure your cursor is located at the end of the file. Now scroll down and double click the read probe alias. Systemtap GUI will insert the skeleton probe at the point at which your cursor is at, and should look similar to the following:
probe syscall.read
{
	/*
	 * available variables on this probe:
	 * argstr, buf_uaddr, count, fd, name
	 */

}
Now insert the following line into the syscall.read probe:
read += count
You may remove the comment (/* ... */) if you wish.
This will count the number of bytes read and written each second and print it out. The begin probe executes first, by getting the time of day. The read and write probes increment each time the function is called. The timer probe prints the information every second. If you typed the script in manually you may have noticed that the editor provides code completion for probe aliasi. If you did not, type "syscall.". You'll see a box come up that you may use to select an item to complete your probe alias.
In Lesson 3 you will learn how to run Systemtap scripts in the IDE Perspective.
Lesson 3: Running Your Script
IDE Tutorial, Lesson Three: Running Your Script
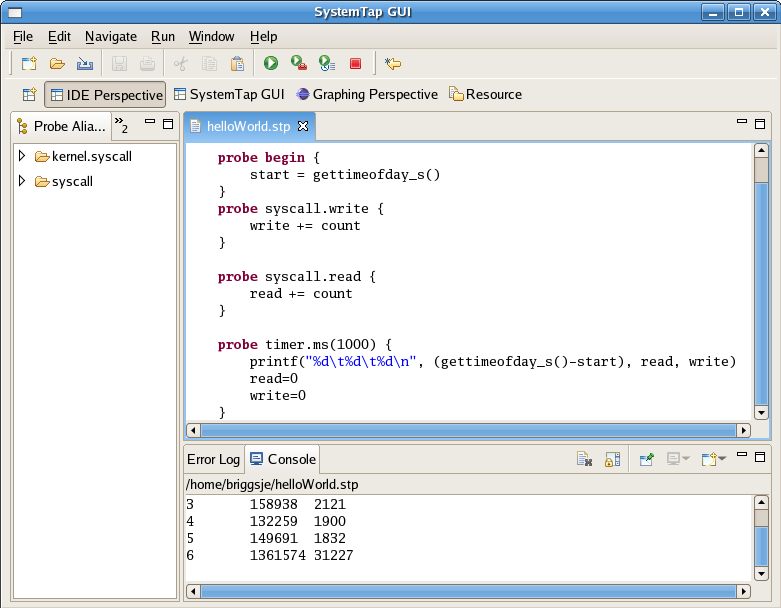
In this lesson we will cover running your script. You may use either the example script you opened in Lesson 1 or the script you wrote in Lesson two. Select Run->Run. Enter the remote server details. You should receive output in the console similar to the following, which shows the reads and write per second.
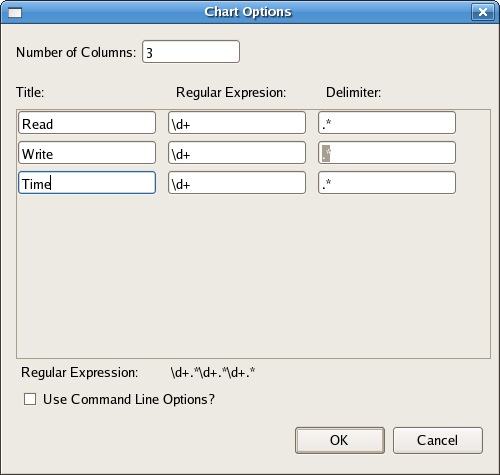
Now we will demonstrate running Systemtap scripts with graphs. In order to run the chart example you'll need to use the code provided in Lesson 2: Writing Your First Script ;. To do this select Run->Run w/ Chart. This feature will prompt the user for the number of columns for the chart, in addition to their titles and regular expressions. The regular expressions are used to parse the console output for the script and determine the values of each column at a certain sample point. The combined regular expression is shown at the bottom of the dialogue box.
For this example enter the following:
	Columns: 3

	TITLE	REGULAR EXPRESSION	DELIMITER
	Time		\d+		.*			\D+
	Read		\d+		.*			\D+
	Write		\d+		.*			\D+
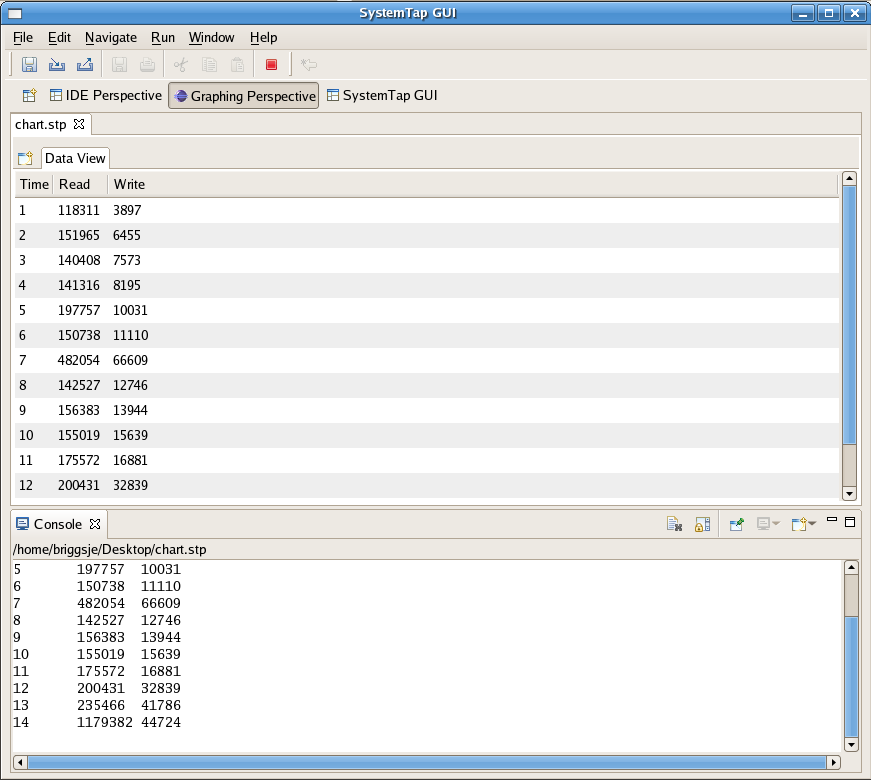
The title fields simply display the associated string in the column's header. After clicking OK the script will prompt you for details regarding the Remote Server. Provide the ip address of the remote server that is running the systemtapgui Server or the Data Management Daemon. The port is by default 22462. Enter a username and password.This will give the application permissions to run your script on the remote machine. You have the option of saving your password as well, however be warned this is currently NOT encrypted so this convenience runs at a risk. The username is also used to transfer the file to the remote system using SCP. If the same machine is used as both the server and the client enter 'localhost' for the Host field. When the script is executed the application will switch into the Graphing perspective. A Data View chart is populated with live data, in addition to the output in the console. You should see a screen similar to the following:
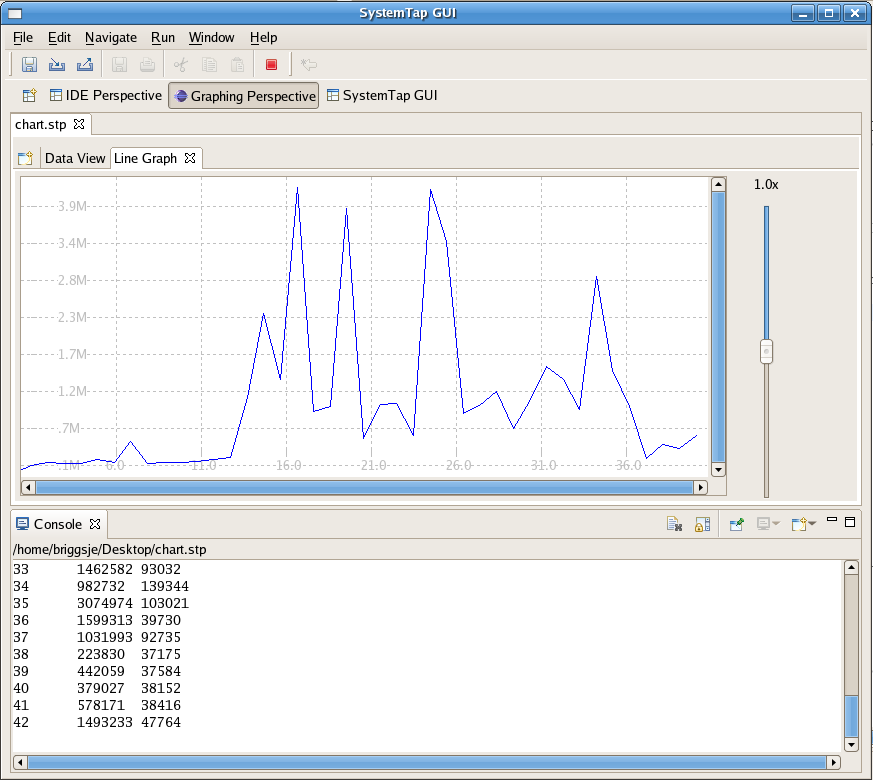
You will see that the data table poplulates from live data parsed from the console. Now we'll make a graph to briefly illustrate the Graphing perspective. Click the Create Graph button next to bring up the Select Chart dialogue.Select line graph. You will be prompted to select a column of the X series and Y series; select "Time" and "Write" respectively. After you click ok you should see the line graph as follows:
Note that the multiple series graphs (Multi-Line, Multi-Bar, and Multi-Scatter) will request two Y series, Y1 and Y2. In the case of our example, these would be "Read" and "Write". Each series will be assigned a different color value for the purposes of differentiation and will be plotted both in respect to the specified X series.
Those are the basics behind running a script in Systemtap GUI.
Concepts
SystemTap Perspectives
STP Editor
Function Browser
Kernel Browser
Probe Alias Browser
Tasks
Creating SystemTap Scripts
Using the STP Editor
Viewing Data Charts
Reference
Views and Editors
Menus
Preferences
Frequently Asked Questions
Example SystemTap Scripts
Guide to Regular Expressions
SystemTap Graphing
For more details on the graphing perspective visit Graphing help page
SystemTap Dashboard
For more details on the Dashboard perspective visit Dashboard help page
© Copyright Red Hat, Inc. 2009
© Copyright Phil Muldoon <pkmuldoon@picobot.org> 2006.
This documentation is licensed under the Eclipse Public License v. 1.0.

