Notice: this Wiki will be going read only early in 2024 and edits will no longer be possible. Please see: https://gitlab.eclipse.org/eclipsefdn/helpdesk/-/wikis/Wiki-shutdown-plan for the plan.
Linux Tools Project/PERF/User Guide
Contents
Overview
PERF is a performance counters subsystem in Linux. Performance counters are CPU hardware registers that count hardware events such as instructions executed and cache-misses suffered. These counters aid in profiling applications to detect hotspots in the application. PERF provides per task, per CPU and per-workload counters, sampling on top of these and source code event annotation.
The PERF plug-in for Eclipse allows the developer to execute profiles in their applications in a seamlessly way, using quick launch actions and visualizing the results in an user-friendly interface.
Launching a Profile
Perf plug-in provides useful profile information in a user-friendly interface, gathering the required information from the Perf command-line tool and hooking it into the Eclipse and CDT's facilities.
During a profile run, the Perf plug-in will start, stop and perform other Perf tasks in the background as needed, while the binary being profiled runs as normal.
One-click launch
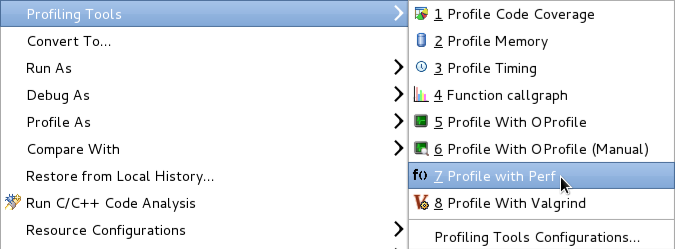
The Perf plug-in for Eclipse includes a one-click launch feature which profiles the binary with default options. To use the one-click launch, right click on the project, the binary or in an open editor for a source file belonging to that project. Then, navigate to Profile As and click Profile With Perf to start the launch.
Launching a Customized Profile
The Perf plug-in allows you to configure a profile run using several options. These options are exposed via the launch configuration in a user-friendly manner, allowing for a more complex profile.
To customize a profile, right click on the project, the binary or in an open editor for a source file belonging to that project. Then, navigate to Profile As > Profile Configurations... to open the Profile Configurations menu. Refer to the Profiling Configuration section for more information about configuring a profile.
After configuring a profile, click the Profile button to launch the profile.
Profiling Configuration
The Perf plug-in has several options to configure, most of them are mirrors of the configuration options that exists on the binary. For more information about all these options refer to the Perf man pages or https://perf.wiki.kernel.org/ .
Perf Options tab
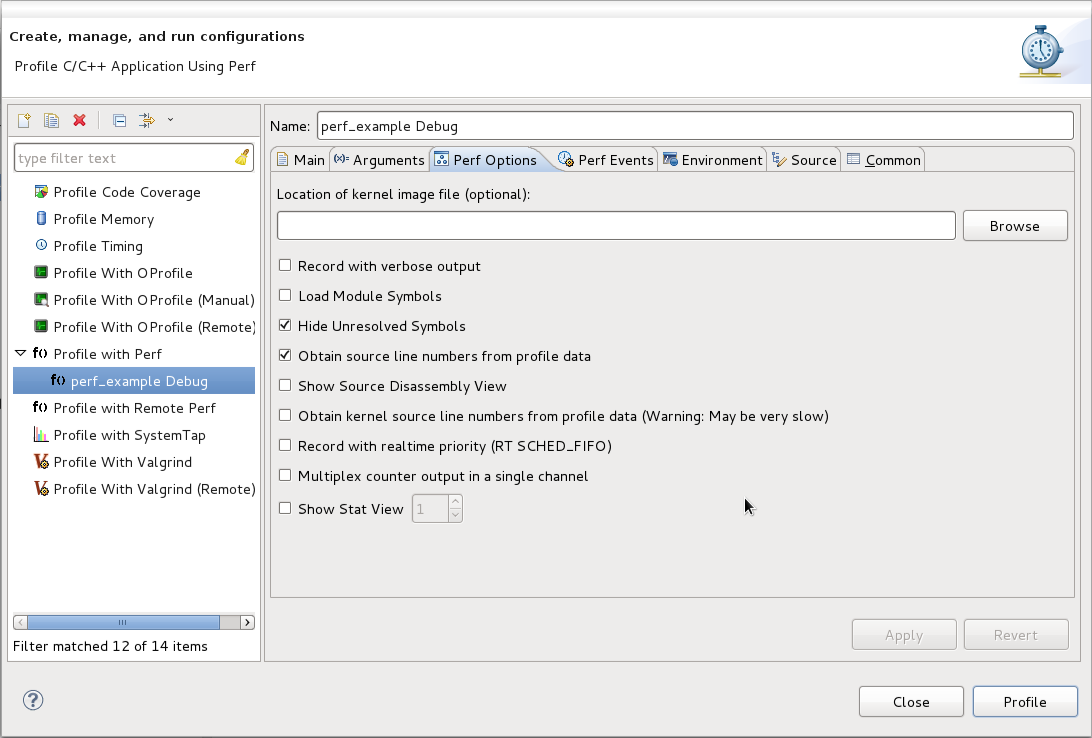
This configuration tab contains runtime options for a profiling with Perf, such as loading a kernel image file or hide unsolved symbols.
Perf Events tab
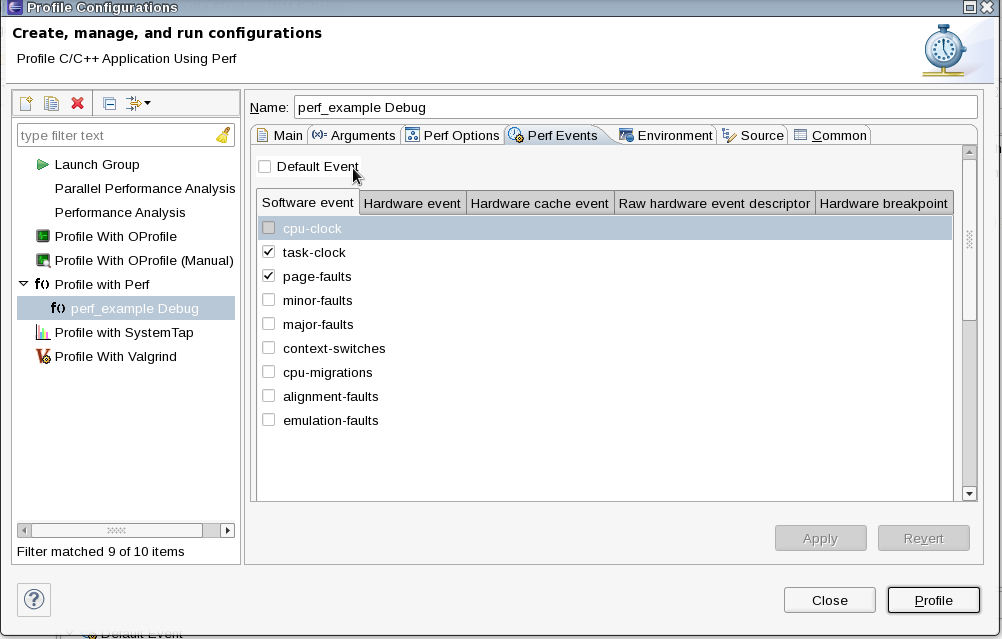
On this tab it is possible to set up a customized array of events for the profiling or, if desired, go with the Default Event option which overrides all other settings and run Perf with the default event (cycle counting).
Perf View
Information about the Perf View.


