Notice: this Wiki will be going read only early in 2024 and edits will no longer be possible. Please see: https://gitlab.eclipse.org/eclipsefdn/helpdesk/-/wikis/Wiki-shutdown-plan for the plan.
Linux Tools Project/PCAP/User Guide
Contents
Pcap Support Within TMF
TMF now supports the reading of libpcap files for network tracing. Those files contains packets that were seen on a network, have a .pcap or .cap extension and can be captured with tools like Wireshark/Tshark/Tcpdump. To open a libpcap trace, simply import it just like any other trace type and TMF will recognize the format. Open the imported trace to see the packets that were captured. For more information about generic features of TMF see the User Guide.
Supported Protocols
Currently, the Pcap integration in TMF can only recognize four protocols: Ethernet, Internet Protocol Version 4, TCP and UDP. In the future, more protocols will be added and supported. If you want to contribute, please see the “Adding a protocol” section in the TMF Developer Guide.
Network Tracing Perspective
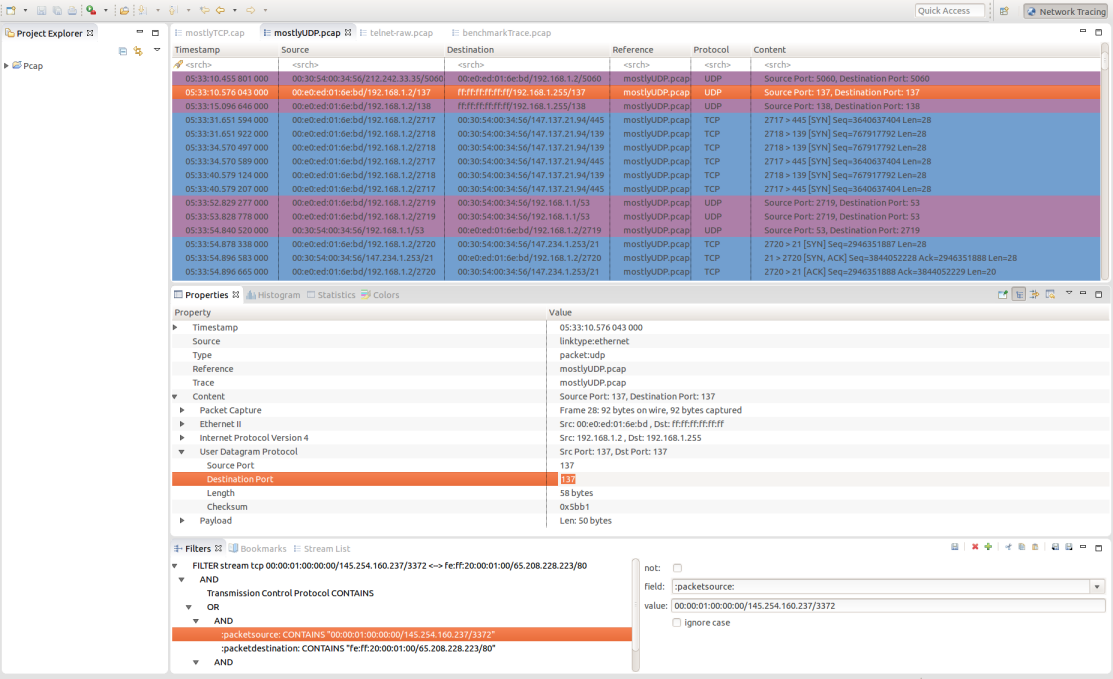
To help analyze the network traces, a new perspective has been created: the Network Tracing perspective. It looks a lot like Wireshark (since it is the de-facto standard) and contains all the views that are useful for network trace analysis. Those views are:
- Event editor: A high-level view of all the packets. It lists all the packets and gives basic information about them, like source, destination, timestamp, protocol, etc.
- Properties View: A low-level view of a particular packet. Once a packet is selected in the event editor, all its fields appear in the properties view.
- Histogram View: A distribution of the packets relative to time. This allows to identify the period where the network was the most solicited, for instance.
- Statistics View: A view of the different packet type present in the trace.
- Colors View: A view used to color the events in the event editor. This is useful for rapidly identifying packet type visually. By default, no event are colored.
- Filter View: A view used to filter the packets for easier analysis.
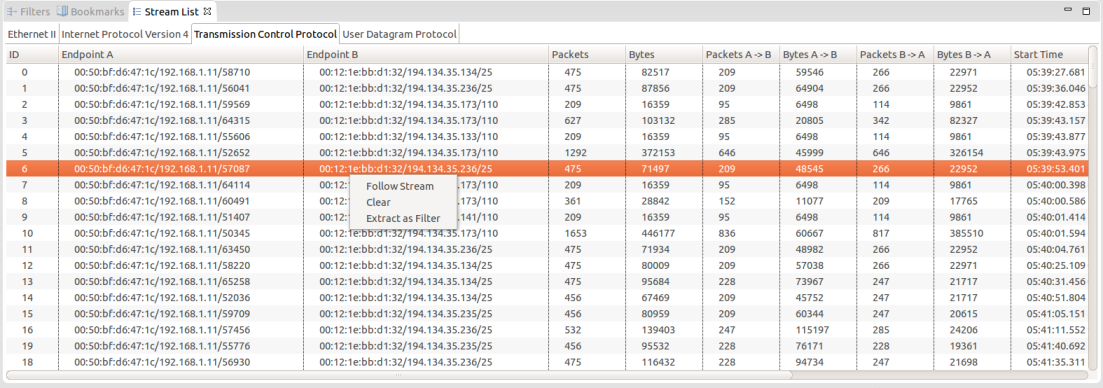
- Stream List View: A view that list all the stream present in the trace/experiment. A stream is a bidirectional flow of packets (a conversation) between two endpoints. An endpoint is either the source or the destination of a packet (which is protocol-dependent).
To open the perspective, select Window > Open Perspective > Other... > Network Tracing.
Filtering On Subfield
It is now possible to filter on subfields, which is really useful for pcap traces. To do so, in the field combo of the Filter View, start with a slash and type the subfield path by separating the different level with a slash. For instance, to get the Source IP Address of the Internet Protocol Version 4, type:
/Internet Protocol Version 4/Source IP Address
If a field name contains a real slash, type “\/” (backslash-slash) instead to make an uninterpreted slash. For instance, to get the field named “Process/Thread”, type:
/Process\/Thread
Stream List View
Most of the time, you want to analyze the conversation between two endpoints (a stream). The stream list view allows you to do just that, by isolating the interesting packets. The Stream List View is updated when a new pcap trace is opened and lists all the different streams present in the trace/experiment, for all the supported protocols. By right-clicking on a stream, you can follow a stream, which will send a TmfNewPacketStreamSignal that can be used by other views to run an analysis on the stream. You can also extract the stream as a filter, which will generate a filter based on the stream attributes. It is then possible to customize that filter and apply it on the event editor to get the interesting packets.
Limitations
- No version check. It assumes the version is 2.4 (which is safe enough, since the format hasn't changed for 10+ years and is not supposed to change anytime soon.
- All timestamps are assumed to be in GMT time.


