Notice: this Wiki will be going read only early in 2024 and edits will no longer be possible. Please see: https://gitlab.eclipse.org/eclipsefdn/helpdesk/-/wikis/Wiki-shutdown-plan for the plan.
Linux Tools Project/OProfile/User Guide
{{#eclipseproject:technology.linux-distros}}
Contents
Getting Started
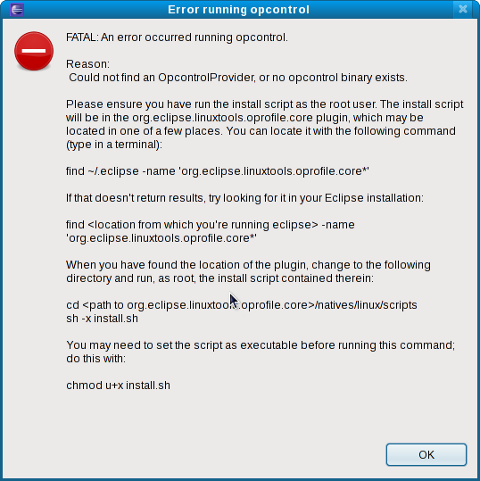
The OProfile plug-in requires a little extra set up compared to other Eclipse plug-ins. However, it only takes a few simple steps and only needs to be done once. After the plug-in is first installed, running most profile-related commands will bring up a dialog similar to the following:
As the dialog suggests, you must run the supplied install script to allow the plug-in to perform OProfile tasks as root (since OProfile can not be run as an unprivileged user). The steps below are the same as the dialog but described in more detail.
Step 1 - Locate Plug-in Installation Directory
Open up a terminal and locate the scripts directory. The install script is located in the org.eclipse.linuxtools.oprofile.core plug-in directory, but this directory can be in a few places:
- If you are using a distro-supplied version of Eclipse and installed the plug-in via the update site, it will most likely be under the
~/.eclipsedirectory, hence use the command:
find ~/.eclipse -name 'org.eclipse.linuxtools.oprofile.core_*'
- Alternatively, if you are using an extracted tarball of Eclipse (ie: you downloaded a .tar.gz from here) then the plug-in will most likely be in the plugins sub-directory of where you extracted it. Let's say you extracted the tarball to
/home/ksebasti, so your Eclipse installation would be in/home/ksebasti/eclipse, then use the command:
find /home/ksebasti/eclipse -name 'org.eclipse.linuxtools.oprofile.core_*'
Note that the quotes (') and asterisk (*) are necessary. Example output will look something like this:
$ find /home/ksebasti/eclipse -name 'org.eclipse.linuxtools.oprofile.core_*'/home/ksebasti/eclipse/plugins/org.eclipse.linuxtools.oprofile.core_0.2.0.200904131051
Then, change the sub-directory natives/linux/scripts of this plug-in directory:
cd /home/ksebasti/eclipse/plugins/org.eclipse.linuxtools.oprofile.core_0.2.0.200904131051/natives/linux/scripts
Note that if you are not the root user while performing these commands, you may have to become the root user and re-execute them in Step 3.
Step 2 - Choose Which Installation Script To Run
In the scripts directory there are two scripts, install.sh and install-noconsolehelper.sh. Both scripts will do some sanity checks to ensure OProfile is installed and that opxml, a C++ program required to interface with OProfile, exists and can be run. The difference is in how root authentication with the plug-in is set up.
-
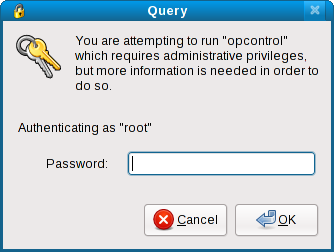
install.shuses the pluggable authentication modules (PAM) mechanism. This is the default and recommended method for root authentication. When an OProfile task is required, you will be presented with this dialog to enter the root password:
-
install-noconsolehelper.shcan be used when consolehelper is not present on the system, or if required PAM modules are not on the system. It uses the sudo mechanism and a small wrapper script. The install script will describe the text which should be written in thesudoersfile, then run the commandvisudoto edit it. Note that thesudoersfile is a sensitive system file and altering it in other ways may lead to system instability. Only users with enough knowledge of running a Linux system should use this method. For these reasons, this method of root authentication is discouraged. However, it may be the only option available to some users and it has been tested to work by developers and users of the plug-in.
Step 3 - Running The Install Script
Now simply run the install script (assuming you are in the scripts directory as in #Step 1 - Locate Plug-in Installation Directory):
./install.sh
Successful output will look like this:
# ./install.shEclipse-OProfile plugin install successful.
Note that the install script must be run as the root user, since both install scripts have some actions which require root -- install.sh places files in /etc sub-directories and install-noconsolehelper.sh runs the command visudo. If you are not already the root user, this command will run only the install script as the root user, then return control to the regular user:
su -c './install.sh'
Successful output will be the same as above. If instead you receive error messages, refer to the Troubleshooting section at the bottom of this page.
Step 4 - Restart Eclipse
That's it! Simply restart Eclipse by clicking File -> Restart and you should be good to go.
Note that if you need to uninstall the plug-in, run the uninstall.sh or uninstall-noconsolehelper.sh script in the scripts directory before uninstalling it from within Eclipse.
Launching A Profile
The purpose of the OProfile plug-in is to provide useful profile information in a user-friendly manner. The first step is to gather this information. The plug-in hooks into the Eclipse and the CDT's launching facilities, hence profiling is no harder than a normal run of your program. The plug-in will start, stop and perform other OProfile tasks in the background as needed, while the binary itself runs as normal. Currently, it is only possible to start profiling when a user binary is run, and stop profiling after the binary has returned. However, there are plans to include a feature to start/stop profiling at arbitrary times in the near future.
One-Click Launch
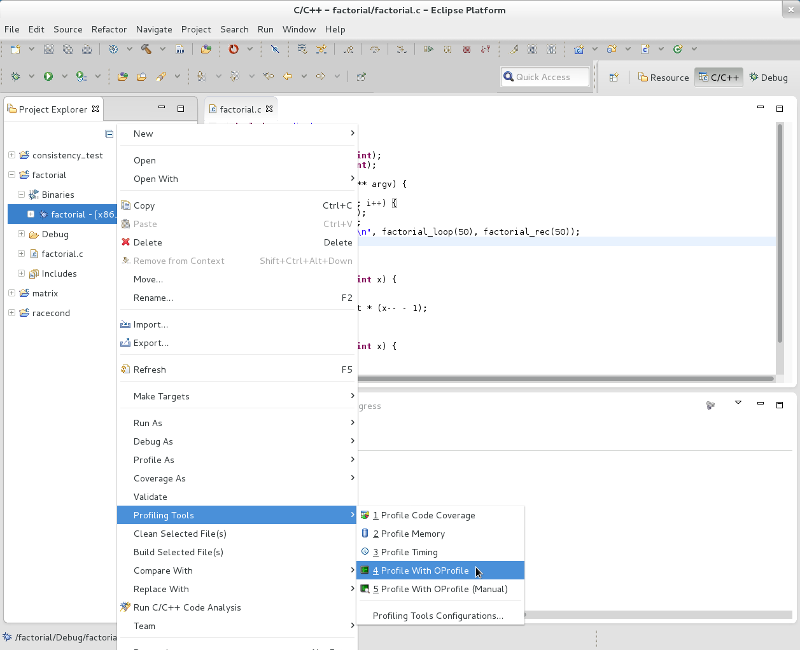
For the majority of users, the most interesting profile is to see where time is spent during execution of the program. A one-click launch feature exists in the plug-in, which will profile with appropriate defaults. Simply right-click on the project, the binary or in an open editor for a source file belonging to that project, navigate to Profile As and click Profile With OProfile to start the launch.
Configurable Profile
OProfile has many options to configure its operation; many of these are exposed via the launch configuration in a user-friendly manner and allows for a more complex profile of your binary. See #Profiling Configuration for details. After configuring these details, simply click the Profile button to launch the profile.
OProfile View
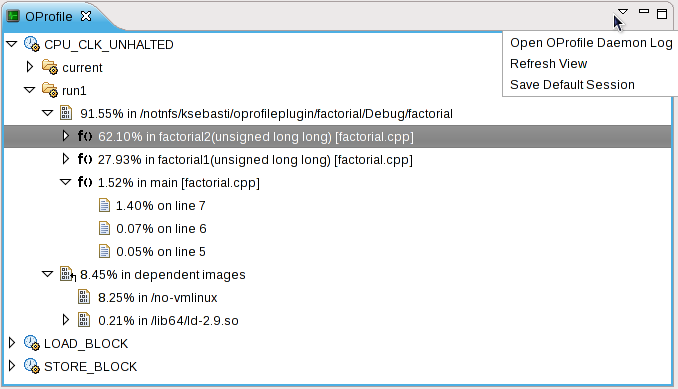
The OProfile view is the central point of interaction of the plug-in with the results of profiling.
Tree Structure
The tree structure shown above describes one or more profiles of one or more events in the following manner:
-
 Events -- the name of the profiling event used by OProfile
Note that if source code is not available, then there may be symbols shown (including source file name) but no samples. This is usually the case with shared libraries. As well, depending on the #Global Settings, there may be no dependent images shown.
Features
This section describes the features of the plug-in exposed through the view.
View Tree
- Double-clicking on a
 sample will open the source file in an editor and place the cursor at that line.
- Note this requires that the source code is available and is in the correct directory (as described in the binary's debug info).
View Menu
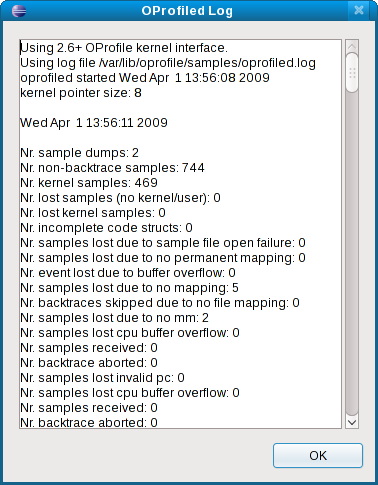
- Open OProfile Daemon Log
- This will launch a dialog showing the contents of the oprofile daemon log (by default in /var/lib/oprofile/samples/oprofiled.log):
- Refresh View
- This will re-read the OProfile data on the system, re-create the internal data model and re-display the profile tree. Also useful to display data already on the system without launching a profile.
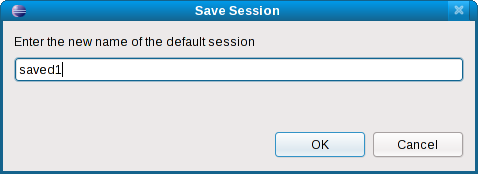
- Save Default Session
- The default session, named
current, is overwritten on each launch of a profile if it is not saved. If you wish to keep the profile for later viewing, this menu action will allow you to save the session to a different name. Note that since the samples are in a system directory, this operation requires the use of OProfile and hence you will be prompted for the root password. The save session dialog is shown below:
- The default session, named
Profiling Configuration
OProfile has many configuration options, which can easily be overwhelming. The profile configuration aims to make the relevant OProfile configuration options easily accessible for all users of the plug-in, experienced with OProfile or not. Currently, there are two configuration tabs added to the standard CDT launch configuration tabs: #Global Settings and #Event Configuration.
Global Settings
The settings exposed in this tab affect the way the OProfile daemon gathers the profiling information. Each option is described below.
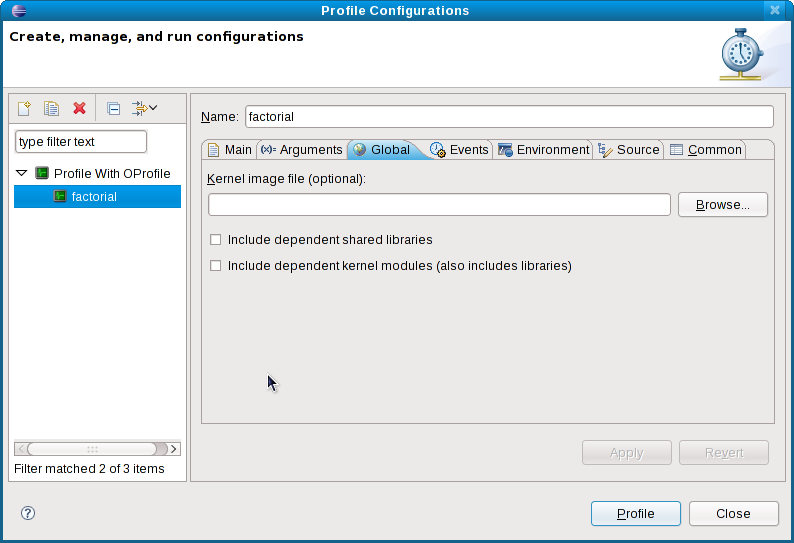
- Kernel Image File
- If you wish to get more detailed information about the operation of your program in the Linux kernel, then point this location to the location of your currently running kernel's
vmlinuxfile. This file contains debugging information required by OProfile. Note that the compressed vmlinux file, often namedvmlinuz, can not be used for this purpose. Note that if Include dependent kernel modules is not checked then this field will have no effect.
- If you wish to get more detailed information about the operation of your program in the Linux kernel, then point this location to the location of your currently running kernel's
- Include dependent shared libraries
- This option will make OProfile keep samples from shared libraries that are used by the binary being profiled and aggregate them in the profile results.
- Include dependent kernel modules
- This option will make OProfile keep samples related to running in the kernel. If the
vmlinuxfile is specified, the profile will include details of the specific kernel modules in use. Otherwise, kernel samples are grouped under the nameno-vmlinux.
- This option will make OProfile keep samples related to running in the kernel. If the
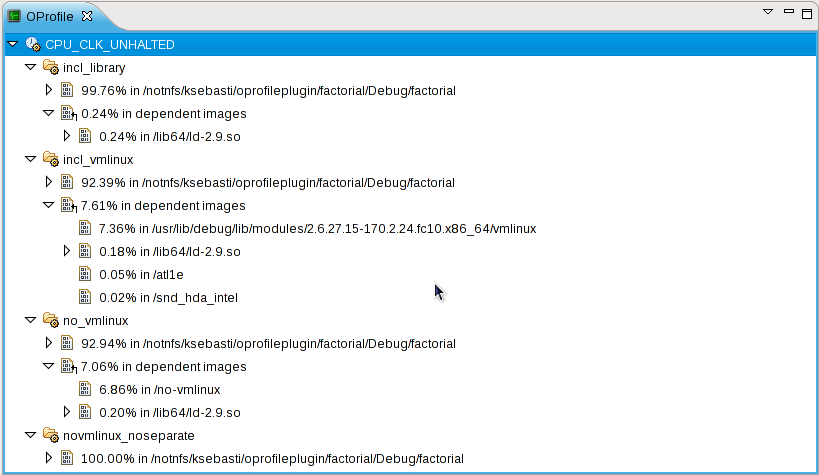
The differences between options is highlighted in the screenshot of multiple sessions below:
-
incl_librarywas run with only the Include dependent shared libraries checked -
incl_vmlinuxwas run with the vmlinux image specified and both Include dependent shared libraries and Include dependent kernel modules checked -
no_vmlinuxwas run with the vmlinux image left empty and both Include dependent shared libraries and Include dependent kernel modules checked -
novmlinux_noseparatewas run with none of the options checked
Event Configuration
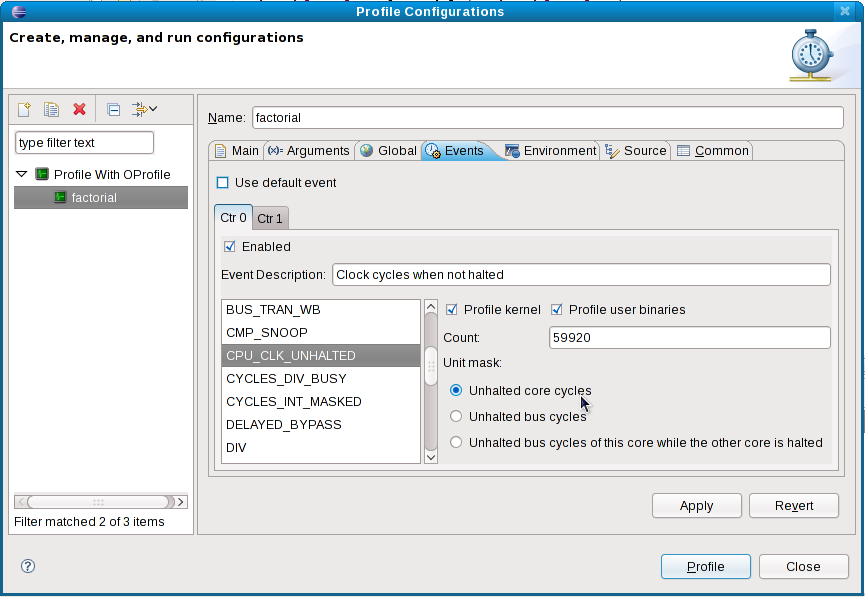
The event configuration tab condenses the (often) large number of options available for configuring the hardware profiling registers of your system's processor.
- Use default event
- The first option use default event is enabled by default when creating a new profile configuration or when a profile configuration is created from a #One-Click Launch. This is a shortcut to use an event based on processor execution time with a reasonable value for Count. Default events are listed for various processors here, at the end of the page.
- Counter Tabs
- A processor may have 1 to 8 hardware profiling registers (also called counters). Each one may be programmed separately to profile many events simultaneously. The tabs labelled Ctr each represent one counter and expose the same options.
- Enabled
- Enable or disable the counter.
- Event Description
- A short description of the function of the selected profiling event; the text is given by OProfile.
- Event List
- A list of the events available for profiling on a given counter.
- Profile Kernel / Profile user binaries
- Instructs OProfile to profile binaries in the selected spaces. Keeping both checked is recommended (even if other #Global Settings are not specified).
- Count
- Specifies a reset count for the hardware counter. In the majority of cases, the default value (based on the CPU's clock frequency) is sufficient. Each event has a minimum value, but it is recommended to use a value many orders of magnitude larger. WARNING: if you specify too low of a value, your program may take much longer to return or your system may hang.
- Unit Mask
- Many events have a unit mask which allows further narrowing of the scope of the event. If in doubt, use the default value (which is provided by OProfile). There are three types of unit masks:
- Mandatory -- no selection necessary; a single required value
- Exclusive -- several possible values; a single required value
- Bitmask -- several possible values; a combination of several values
- Many events have a unit mask which allows further narrowing of the scope of the event. If in doubt, use the default value (which is provided by OProfile). There are three types of unit masks:
Timer Interrupt Mode
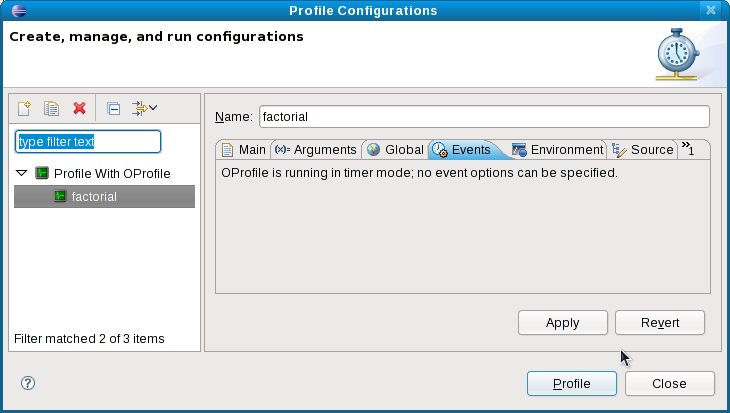
Note that if your processor (or kernel) does not support the hardware profiling registers OProfile uses, OProfile will run in timer-interrupt mode. The event configuration tab will then look like the screenshot below:
Example Use
- stuff goes here
Troubleshooting
- install script fails
- no samples
- log reader hanging

